| Home: Global Wood |
|
Industry News & Markets |
|
U.S. Construction materials
prices edge higher in June |
|
The producer price index (PPI) report from the Bureau of Labor Statistics (BLS) stated that construction materials prices were up 0.1 percent month-over-month in June on a seasonally adjusted basis. In addition, the change in construction materials prices for May was revised to a 0.1 percent decline from the last month’s report of it being unchanged. The index of components and materials for construction was up 1.4 percent from its year-earlier level. Overall prices for processed goods for intermediate demand were down 0.2 percent for the month. The volatile prices of processed fuels and lubricants fell 1.1 percent. The overall processed goods for intermediate demand index was 0.5 percent lower than its year-earlier level. For reference, the changes in these indices compare with a 3.0 percent rise in the all-items consumer price index (CPI-U) for the 12 months ending in June. The seasonally adjusted June CPI-U was down 0.1 percent from May’s level despite a fractional rise in the unadjusted index. Energy prices were down 2.0 percent for the month but up 1.0 percent year-over-year. The shelter portion of the CPI-U was up 0.2 percent for the month and was 5.2 percent higher than its year-ago level. Seasonally adjusted rent of primary residence was up 0.3 percent for the month and 5.1 percent year-over-year. Yield Pro compiled the BLS reported changes for our standard list of construction materials prices. These are prices of materials which directly impact the cost of constructing an apartment building. The first two right hand columns of the table provide the percent change in the price of the commodity from a year earlier (12 Mo PC Change) and the percent change in price from May (1 Mo PC Change). If no price data is available for a given commodity, the change is listed as N/A. The pre-COVID column lists the change in the current construction materials prices relative to the average of prices from December 2019 through February 2020, before the pandemic impacted the economy. This provides a longer-term view of construction materials price trends. 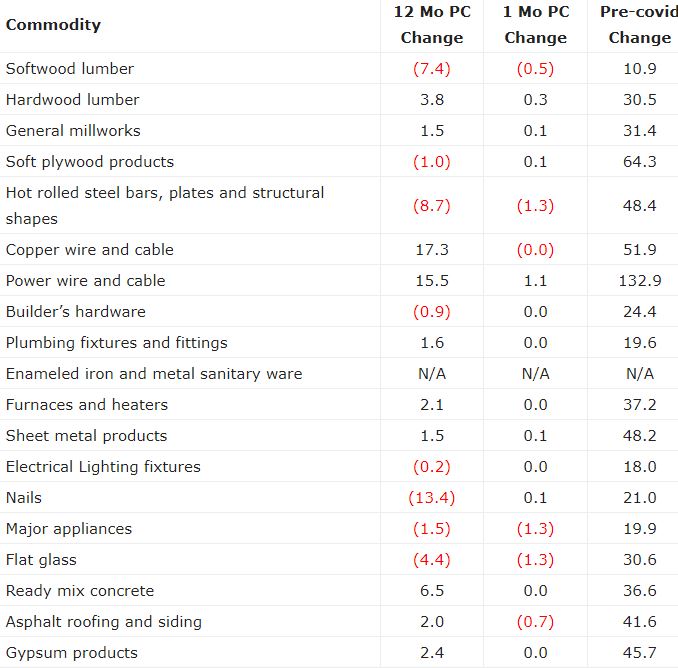 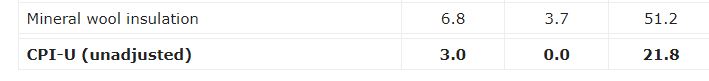 The prices used by the BLS in compiling the indexes are collected on the Tuesday of the week containing the 13th day of the month. In June that would have been June 11. In the July report, the data collection date will be July 9. The first chart, below, shows the price index history for wood products over the past 37 months. 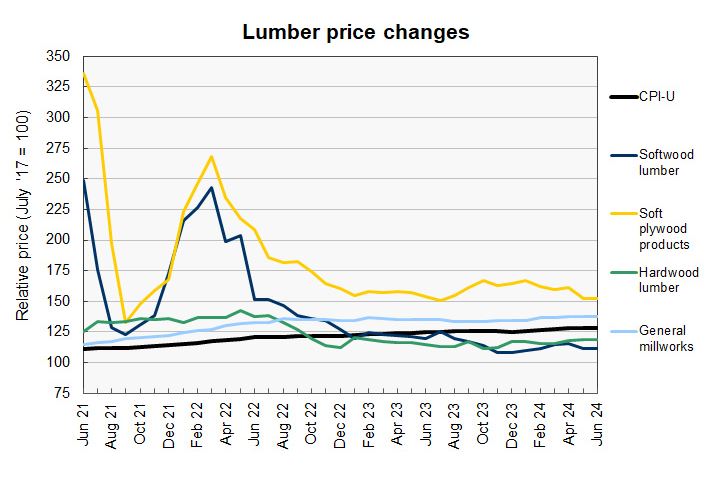 Within wood products, the largest reported price change was for softwood lumber, whose price index was reported to fall 0.5 percent for the month. However, the largest price index change from the level reported last month was for soft plywood products. Last month’s price index was revised lower by 4.3 percent in this month’s report, meaning that its price index is now 4.2 percent lower than that reported last month despite the 0.1 percent rise reported for June. While prices for other wood products that we track are well off of their highs, the price of general millworks set a new high in June. The next chart, below, shows the recent history of several other construction materials prices. These are relatively simple commodities whose prices are strongly driven by those of the materials of which they are comprised.  After making big jumps in recent months, the price index for copper wire was nearly unchanged this month, falling fractionally. It remains the leader for year-over-year price growth but trails power wire and cable by a wide margin for highest post-COVID price increase. Last month’s price index for power wire and cable was revised lower by 1.3 percent this month. While its price index was reported to rise 1.1 percent this month, it is actually down 0.2 percent compared to the preliminary value for May reported last month. Price changes for several of the more finished goods from our sample are illustrated in the final chart, below. Note that the price index category for enameled iron and metal sanitary ware has disappeared from the detailed data reported with the producer price index. It seems to have been rolled up into the plumbing fixtures and fittings category and so will be dropped from this summary in the future. 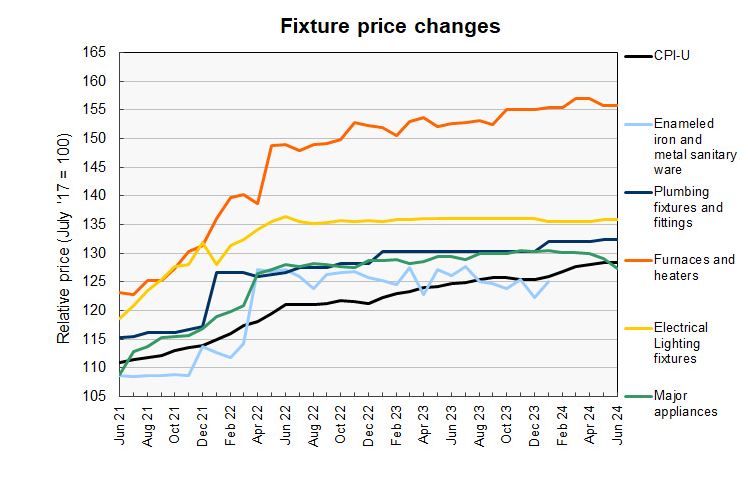 The price indexes for these goods have been remarkably stable recently with 3 of the 4 indexes being exactly unchanged for the month, or nearly so. Only the major appliances index showed movement, falling 1.3 percent for the month. The full current BLS report can be found here. Source: yieldpro.com |