| Home: Global Wood | Industry News & Markets |
°°
| Home: Global Wood | Industry News & Markets |
°°
| News
Release
November 1, 2004 New AKTRIN Report on : °° This book analyzes the economic and demographic
forces impacting the demand for household furniture in the The 2003
value of the furniture market in the Measured
at manufacturers?prices domestic household furniture sales reached an estimated $34.0
billion in 2003 or about 47.5% of the total dollars spent by Over the
last two decades household furniture purchases increased significantly from $23.8 billion
in 1983 to $71.6 billion in 2003, or more than tree times. In other words, sales increased
at an average annual pace of 6.1% over this period. However, growth has been much slower
recently, and in 2003 growth of household furniture sales was only 2.7%. Some of
the growth during the past 20 years was due to rising prices. If expressed in constant
2000-dollar terms, the increase between 1983 and 2003 was 2.6 times, that is from $ 29.0
billion to $ 75.4 billion. The
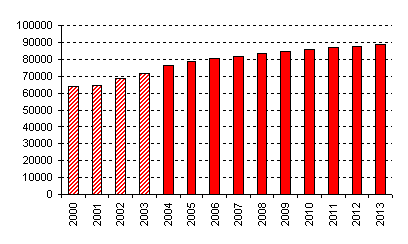
number of households in the Based on
these assumptions, We expect furniture spending growth to continue throughout the
projection horizon, slowing from an annual rate averaging around 3.3% Household
Furniture Spending 2000 (in
millions of constant 2003-Dollars) |
 |
| AKTRIN is a report writing and international
consulting firm fully dedicated to the furniture industry. The company has been in
existence since 1985 and maintains offices in the United States, Canada, Mexico and
Germany . Representatives and affiliates are located throughout the world. For more information click: http://furniture-info.com/102.htm |
CopyRight 2004 Global Wood Trade Network.
All rights reserved
°°