Japan
Wood Products Prices
Dollar Exchange Rates of 10th
September
2026
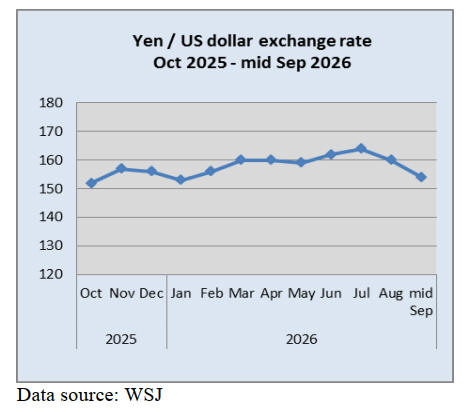
Japan Yen 154.43
Reports From Japan
Exchange rate reshaping the corporate landscape
The Japanese yen’s recent rapid appreciation to around
¥154 against the U.S. dollar is fundamentally reshaping
the corporate landscape in Japan according to the domestic
media.
For companies dependent on foreign inputs, the yen's
upswing serves as a critical financial lifeline. Domestic
sectors like consumer goods, food distribution and energy
are finally seeing relief from import inflation that triggered
a multi-year wave of bankruptcies when the yen neared
historical lows of 164 to the US dollar.
The retail sector, which has been struggling to pass on
high import costs to price-sensitive Japanese consumers, is
reporting expanding margins.
Every incremental gain in the yen directly protects
domestic purchasing power. Conversely, for Japan’s
exporters the rapid currency correction is completely
upending financial projections. For years, a historic weak
yen boosted the profits of Japan’s heavy exporters. The
sudden and rapid reversal is eroded the competitive
advantage.
Market strategists note that, while semiconductor and AI-
related equipment manufacturers have enough structural
global demand to endure currency fluctuations, the
broader manufacturing sector faces a a challenge. If the
yen gets stronger than ¥150 per dollar, overall corporate
earnings growth are expected to fall sharply.
While the suddenness of the yen's upswing has caught
some manufacturers off guard, it corrects a deep economic
imbalance. The transition could shift market direction
away from pure export-reliance and toward sustainable,
domestic-led growth supported by higher purchasing
power and steady policy normalisation.
See: https://asia.nikkei.com/business/markets/currencies/yen-s-
recent-upswing-catches-japan-manufacturers-off-guard
Wide gap in business sentiment – small companies
suffering
The latest Cabinet Office ‘2026 Business Outlook Survey’
showed the business sentiment index for large
corporations across all industries at +5.3, turning positive
for the first time in two quarters. Manufacturers posted
+7.6, driven by strong demand for semiconductor
manufacturing equipment and other production machinery
amid expanding AI and data center investment.
However, sentiment in small and medium enterprises
remained in negative territory for the 50th consecutive
quarter, underscoring a persistent gap in sentiment by
company size.
See:
https://www.mof.go.jp/english/pri/reference/bos/e1c202602.htm
and
https://finance.biggo.com/news/5c627e4b-5daa-4990-8250-
ff2591e9443e
BoJ rate increase widely anticipated
The US Treasury Secretary recently met with Bank of
Japan (BoJ) Governor, Kazuo Ueda and a Treasury
Department statement says the Treasury Secretary
“expressed strong support for Japan’s decisive market and
monetary steps to address the substantial undervaluation of
the yen.” In mid-September the yen rallied, with the
currency strengthening to breaking ¥154 to the dollar for
the first time in months.
At the 17 and 18 September BoJ Policy Board meeting it
is widely expected that a rate increase will be announced.
In late July, Japan and the United States intervened to
support the yen, with Japan alone spending about US$100
billion in the operation. The efforts took the yen from
about ¥164 to the dollar to around ¥155 but much of the
gain was erased in just a month.
Some analysts argue that the recent strengthening is
probably not the result of intervention, as the currency is
not appreciating fast enough to suggest official buying.
They said that the rebound, which began on 2 September
might be due to a sense that Japan might act with more
resolve to stop the currency from weakening after
encouragement from the US to do something.
See:
https://www.japantimes.co.jp/business/2026/09/03/markets/yen-
market-rally/
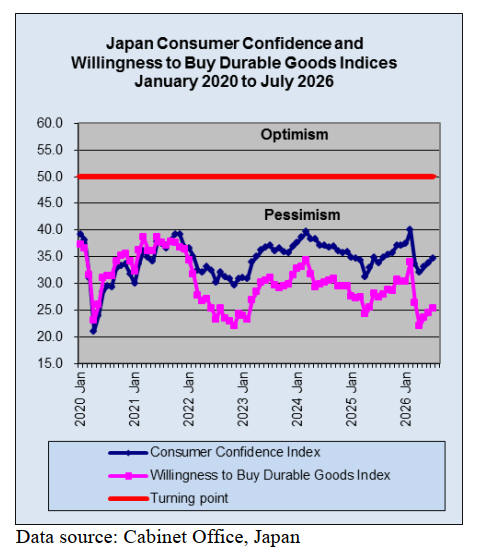
Middle class losing spending power
Estimates suggest real take-home pay in July slid 10%
post-COVID because stubborn inflation and tax burdens
outpace nominal wage gains. Household spending figures
continue to trend downward as gloomy consumer
sentiment causes self-preservation spending habits.
Japan's gloomy consumer sentiment is primarily driven by
"cost-push" inflation squeezing household budgets after
decades of flat prices. While corporate earnings and
nominal wages have technically gone up, the spike in the
cost of daily necessities has far outpaced actual purchasing
power. This has left consumers feeling poorer and deeply
anxious about the future.
For over thirty years, Japan experienced stagnation or
deflation. Consumers grew accustomed to stable, flat
prices. The recent wave of inflation, driven by a severely
weakened yen making imports expensive and disruptions
in global supply chains, has fundamentally shocked
consumers.
A breakdown of how these components tend to behave
during recent economic shocks illustrates why the mood is
so low. Japan measures consumer confidence across four
main lenses. Overall Livelihood, Willingness to Buy
Durable Goods, Employment Outlook and Income
Growth:
The livelihood index Income tuned lower during
energy and oil price spikes due to a direct
correlation with immediate out-of-pocket costs.
Consumers are deferring major, non-essential
purchases such as household items) to preserve
cash for food and utilities.
While the baseline unemployment rate remains
low, the erosion of secure, lifetime career paths
lowers long-term confidence.
Even if bonuses or base pay tick up marginally,
these will be eroded by the decline in the yen's
purchasing power.
See: https://asia.nikkei.com/economy/japan-middle-class-loses-
spending-power-despite-years-of-pay-raises
and
https://japannews.yomiuri.co.jp/business/economy/20260818-
344135/
Outlook for economic activity
According to a Bank of Japan (BoJ) assessment Japan's
economy is expected to continue growing moderately,
albeit at a decelerated rate, in fiscal 2026. This will be
because, although the rise in crude oil prices since early
spring, the economy is likely to be underpinned by factors
such as the government's measures and accommodative
financial conditions, in addition to an increase in global
AI-related demand.
Japan's economic growth rate is likely to rise moderately
from fiscal 2027 onward, since it is projected that the
adverse effects of high crude oil prices will wane and that
a virtuous cycle from income to spending will gradually
intensify.
The year-on-year rate of increase in the consumer price
index (CPI, all items less fresh food) is likely to accelerate
to a level above 2% from the second half of fiscal 2026.
This is because a rise in crude oil prices is expected to
push up prices, especially energy. Thereafter, with the
waning of the effects of high crude oil prices, the rate of
increase is expected to decline toward around 2% in the
second half of the financial year.
Against this background, the Cabinet Office assessment is
that underlying CPI inflation is expected to increase
gradually, coming to a level that is generally consistent
with the price stability target between the second half of
fiscal 2026 and fiscal 2027 and remaining at around that
level thereafter.
According to the Cabinet Office the preliminary July 2026
Coincident Index of Business Conditions rose by 1.7
points month-on-month to 120.6, maintaining a baseline
assessment of "showing improvement".
See: https://www.boj.or.jp/en/mopo/outlook/gor2607b.pdf
and
https://www.esri.cao.go.jp/en/stat/di/di-e.html
Construction among the sectors suffering acute
labour
shortage
The work force in Japan’s construction sector is ageing
faster than it can be replaced. The demographic crisis,
declining birth rates, rapid ageing and a shrinking
workforce has been developing for decades.
Construction is among the sectors suffering most acutely.
Research from the IMF’s 2025 Article IV report found that
population ageing is contributing directly to severe labour
shortages in Japanese firms, with construction identified as
one of the three most affected sectors alongside
information technology and medical services.
Japan’s construction cost inflation is driven by persistent
labour shortages, material cost volatility and ongoing
capacity constraints. That pace of escalation is expected to
remain elevated through 2027.
The job-to-applicant ratio in Japan, a measure of how
many positions exist relative to job seekers, is at 1.24
across the economy, meaning there are 124 job openings
for every 100 people looking for work. In construction, the
ratio is significantly more strained. Companies have been
forced to increase wages and draw on senior workers well
past conventional retirement ages.
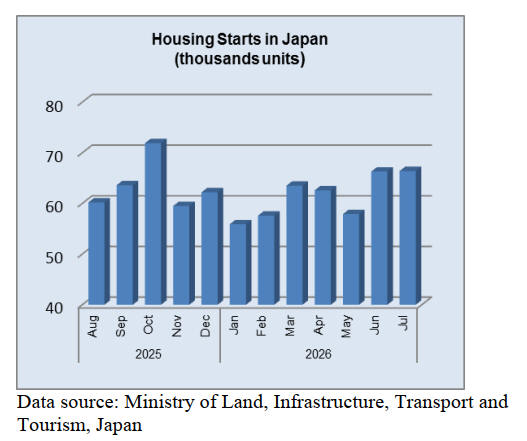
In related news, declining housing starts have forced
Japanese construction and homebuilding companies to
pivot toward overseas markets, shift focus to home
renovations and consolidate operations amid a severe
domestic labour shortage.
Nomura Research Institute forecast Japan's new housing
starts will decline to 800,000 units in fiscal 2030 and
610,000 units in fiscal 2040, extending the country's long-
term downtrend in home construction. The renovation
market is expected to reach 9.2 trillion yen in 2040, up
from about 8.3 trillion yen in fiscal 2024.
See: https://thegoodbuilder.com.au/japans-construction-time-
bomb-who-builds-a-country-when-the-builders-are-too-old/
and
https://www.nri.com/en/service/industry/housing_construction_e
state/resi.htm
Import update – wooden furniture and parts
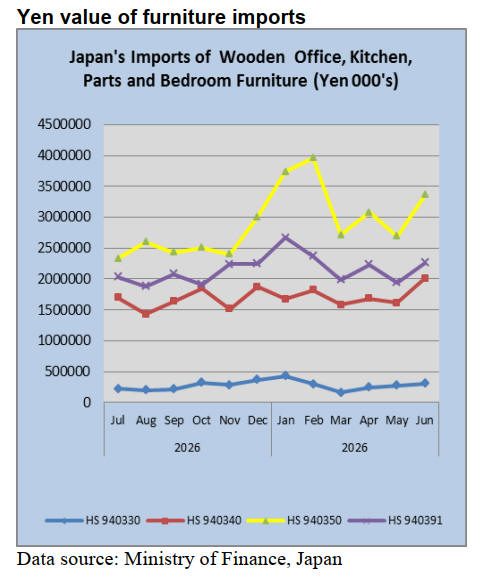
Japan's wooden furniture imports rose by 9.5% year-on-
year in June 2026 due to a combination of corporate office
refurbishments, active housing and living-space demand
and inventory adjustments by major retailers ahead of
anticipated logistics cost pressures.
Steady expansion in home and office furniture sectors,
driven by compact living trends and corporate shifts
toward flexible office layouts, bolstered inbound orders.
The average price for office, kitchen and bedroom
furniture from major Asian shippers has contracted by
around 5% since the beginning of the year encouraging
bulk importing and replenishments from key Asian
manufacturers. Importers front-loaded shipments in June
to secure supply chains amidst broader concerns over
rising global maritime freight volatility
See:
https://www.lesprom.com/en/analytics/Japan_s_imports_of_woo
d_furniture_grow_10_in_June_2026_9428/
and
https://www.mordorintelligence.com/industry-reports/japan-
home-furniture-market
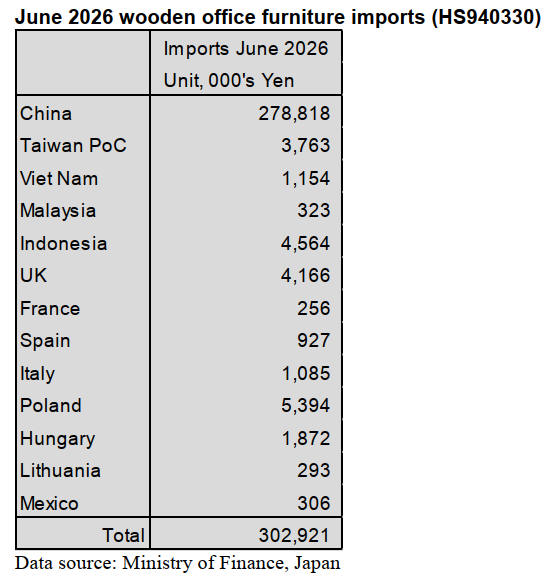
June 2026 wooden office furniture imports
(HS940330)
The value of June imports of wooden office furniture
imports from the top shipper, China, was up 11%
compared to May, building on the 39% increase seen in
May. As in May China accounted for over 90% of Japan’s
June imports of wooden office furniture. A further 2% of
the total value of imports was from Poland (a doubling off
the value of May imports). Indonesia and Malaysia each
contributed around 1.5% of the value of June imports.
Year on year, the value of wooden furniture imports in
June 2026 jumped 60% and there was a 60% month on
month increase in the value of imports.
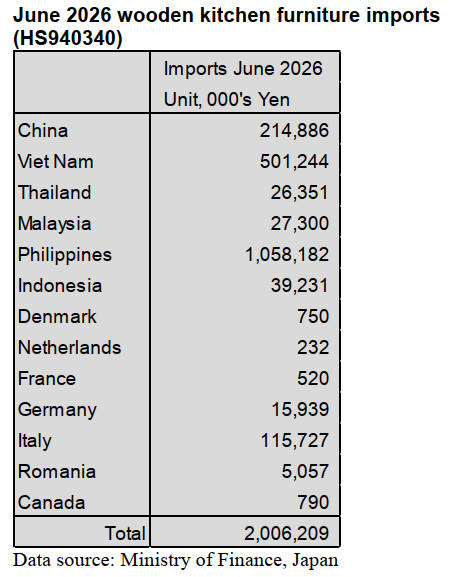
June 2026 wooden kitchen furniture imports
(HS940340)
In June shipments from the Philippines accounted for 53%
(54% in May) of total wooden kitchen furniture imports
and a further 25% (39% in May) was sourced in Viet
Nam. Many exporters operating in the Philippines are
subsidiaries or partners of international networks that have
streamlined logistics directly into major East Asian
consumer markets like Japan.
China was the third ranked source accounting for around
11% of June arrivals. The other significant shipper in June
was Italy which saw the value of shipments to japan more
than quadruple compared to the value of May arrivals.
Year on year the value of June 2026 wooden kitchen
furniture imports was up 18% compared to the value of
May imports while month on month there was a 25%
increase
The value of imports from the Philippines in June was up
23% month on month while the value of shipments from
Viet Nam was at around the same level as in May.
Shipments from China increased 15% compared to May
shipments.
Many exporters operating in the Philippines are
subsidiaries or partners of international networks that have
streamlined logistics directly into major East Asian
consumer markets like Japan.
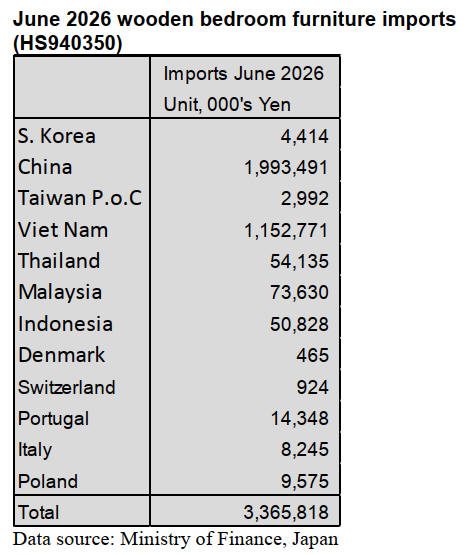
June 2026 wooden bedroom furniture imports
(HS940350)
Two countries accounted for 93% of the value of
HS940350 imports in June; China, 59% (64% in May) and
Viet Nam 34% (29% in May) The other significant
suppliers of wooden bedroom furniture to Japan in June
were Malaysia, Thailand and Indonesia with a combined
value equivalent to around 5% of all June imports.
The total value of arrivals of wooden bedroom
furniture in
June 2026 were up around 44% compared to June 2025
and compared to May levels there was a 25% rise.
The value of imports from China in June 2026 was up
15% month on month, from Viet Nam, up 550% month on
month. For the other main suppliers Malaysia down 21%,
Thailand up 6% and Indonesia up 15%.
Most of Japan’s imports of utility bedroom furniture from
China and Viet Nam, while higher-value and often crafted
furniture come from Indonesia. China supplies the largest
share of Japan's basic and flat-pack wooden bedroom
furniture. Buyers source from Indonesia for unique
designs and durable tropical hardwoods rather than mass
volume.
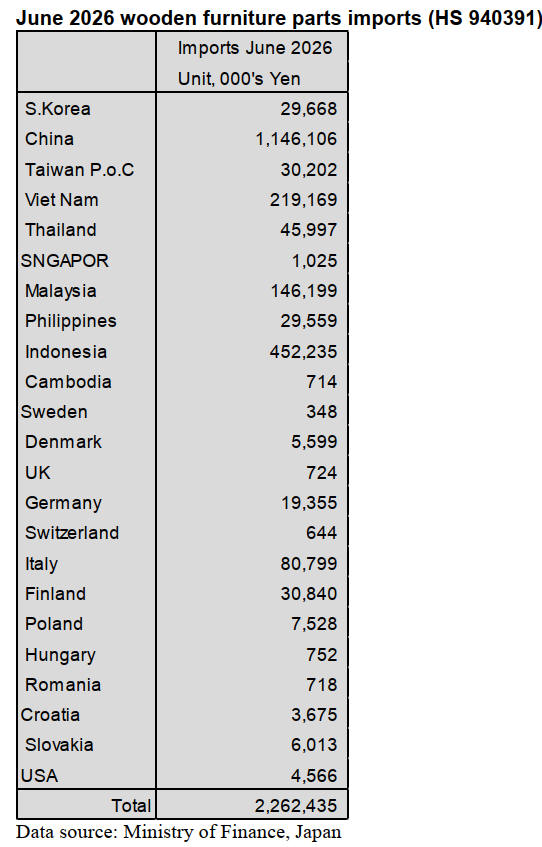
June 2026 wooden furniture parts imports
(HS940391)
From the beginning of 2026 there has been a general
downward trend in the value of imports of wooden
furniture parts but June imports reversed the trend rising
11 year on year and by 17% month on month.
As in previous month’s shippers in China and three SE
Asian countries, Indonesia Viet Nam and Malaysia
accounted for 87% (89% in May) of Japan’s imports of
wooden furniture parts (HS940391) in June 2026.
The main shipper of wooden furniture parts to Japan in
June was China at 51% (49% in Mayl) followed by
Indonesia at 20% (20% in May), Viet Nam 10% (12% in
May) and Malaysia 6% (4% in May).
The value of imports from China in June 2026 was up
month on month by 20%, imports from Indonesia were up
19% compared to May, imports from Viet Nam were
down 6% the second monthly decline 23%. The big
winner in June was Malaysia where the value of shipments
to Japan rose 72%.
Exporters in major manufacturing hubs are reducing
prices
to target alternative destinations like Japan, mitigating
risks from shifting international trade policies and tariffs
in Western markets. Buyers in Japan are securing more
competitive procurement costs for wooden furnishings,
easing cost pressures from the yen exchange rate
fluctuations.
Trade news from the Japan Lumber Reports (JLR)
The Japan Lumber Reports (JLR), a subscription trade journal
published every two weeks in English, is generously allowing the
ITTO Tropical Timber Market Report to reproduce news on the
Japanese market precisely as it appears in the JLR. For the
JLR report please see: https://jfpj.jp/japan_lumber_reports/
Wood exports during the first half of 2026
Japan’s wood exports reached ¥32.044 billion in the
January–June period, up 4.1% from a year earlier and
marking a new record high.
Log exports totalled ¥16.985 billion, up 3.9% from a year
earlier, while lumber exports reached ¥5.136 billion, a
6.2% increase. Although logs made up the larger share of
overall export value, growth in lumber shipments, driven
mainly by demand from the United States, was particularly
strong.
In volume terms, log exports totalled 1,003,407 cbms,
down 2.9% from a year earlier, while lumber exports came
to 97,822 cbm, a 0.4% decline.
By destination, log exports totalled 910,252 cbms to
China, 62,562 cbms to South Korea, 27,305 cbms to
Taiwan, and 3,037 cbms to Vietnam. Meanwhile,
shipments to South Korea and Vietnam increased, but
exports to China—the main market—fell 3.5% from a year
earlier, and volumes to Taiwan also declined.
China remained the largest market, with export value
reaching ¥15.36 billion. Despite a decline in shipment
volume, the sheer scale of exports meant that the weaker
yen pushed the figure 3.6% higher from a year earlier.
Lumber export volumes totalled 29,125 cbms to China,
5,203 cbms to South Korea, 8,410 cbms to Taiwan, 33,840
cbms to the United States, 10,704 cbms to the Philippines,
and 10,540 cbms to other destinations. In value terms,
exports to the United States rose 20.1% from a year earlier
to ¥2.351 billion, while shipments to South Korea and
other destinations also increased.
Plywood
Domestic softwood plywood continued to move steadily in
direct-demand channels such as major precut factories and
house builders, while the lumber-yard route remained
sluggish due to lingering inventories from April and May.
Manufacturers held August prices at ¥1,450 per cbm, a
level increasingly accepted by direct-demand buyers,
though lumber-yard distributors have yet to fully adjust,
keeping the central market at ¥1,420– 1,430 per cbm. For
September, manufacturers aim to maintain prices amid
high production and transportation costs, preparing for
potential increases from October, even as some
distributors suggest stabilizing prices may be appropriate.
Imported tropical plywood from Malaysia and Indonesia
continues to show strong supplier pricing driven by rising
costs for adhesives, raw logs, and fuel. Wildfires in
Sumatra and Borneo have not affected production, but
Malaysian coated formwork plywood faces coating-
material shortages that may reduce arrivals. Production
delays at mills in both countries have begun to improve,
and some Indonesian producers are shifting ordinary
plywood from the U.S. market to Japan due to tariff
factors, though prices remain high. Supplier prices
strengthened further across major specifications.
In Japan, imported plywood movement in July was
notably slow, leaving port inventories full. Even so,
expectations are emerging that coated formwork plywood
may begin to move around September. Market prices
remain stable across coated and ordinary plywood
categories.
Domestic lumber and logs
Domestic softwood lumber continues to move steadily in
direct-demand channels such as precut factories and
builders, while city lumber exchanges have remained
sluggish since April. Sawmills relying on these exchanges
are struggling, with nuki dōburi, a type of Japanese furring
strip used in traditional post-and-beam construction,
particularly weak in Kanto—sales at some mills are about
20% below normal, prompting a shift toward KD studs.
Nuki dōburi remains around ¥50,000 per cbm, while
Tohoku mills supplying direct-demand buyers in Kanto
continue to see stable movement. Northern Kanto
sawmills are also busy, with pillar-specialized mills
carrying backlogs equal to two months of production. In
city markets, 105 mm KD special-grade cedar pillars
remain around ¥60,000 per cbm, though some mills quote
¥62,000–65,000.
KD special-grade cedar studs also show firmness, trading
at ¥65,000 per cbm, while direct-demand buyers purchase
at ¥62,000–63,000.
Plywood supply in first half of 2026
The supply of plywood in the first half of 2026 reached
2,356,264 cbms, edging up 0.8% from a year earlier and
marking a slight increase. Domestic plywood production
fell to 1,264,530 cbms, down3.1% from the same period a
year earlier.
The decline is attributed to disruptions in adhesive
materials, as plywood manufacturers faced difficulties
procuring adhesives from late March through May amid
heightened tensions in the Middle East, limiting their
ability to maintain planned output.
Imports of plywood totalled 1,091,734 cbms, up 5.8%
from a year earlier, exceeding the level seen in the same
period last year. End-June inventories stood at 133,186
cbms, down 7.2% from the previous month and marking a
fourth consecutive monthly decline.
Production of softwood structural plywood in June rose
14.4% from the previous month, with output increasing
across all thickness categories. June’s output is also
believed to include volumes that had been delayed during
April and May. Shipments of softwood structural plywood
in the first half of the year were nearly flat, slipping 0.5%
from a year earlier. Imports of plywood in the first half of
the year rose 5.8% from a year earlier.
By source, shipments from Malaysia fell 8.8% year-on-
year, while those from Indonesia increased 7.3%. Both
Malaysian and Indonesian producers are experiencing
delays in fulfilling contracted volumes due to a
combination of log shortages and rising production costs.
Imports from China also increased, rising 13.3% from a
year earlier.
North American Log Imports in First Half of 2026
Imports of U.S. softwood logs in the first half of 2026
January–June) totalled 656,107 cbms, a 20.9% decline
from the same period a year earlier.
Although this marks the first decrease in two years,
volumes were still 16.8% lower than in the first half of
2024 and are believed to be the lowest since the peak
period for U.S. log imports. Both supplying countries saw
declines, with the United States shipping 485,847 cbms,
down 13.4% year on year, and Canada delivering 170,260
cbms, a 36.6% drop. The contraction was particularly
pronounced for Canadian shipments.
Shipments of Douglas fir, the main species,fell to 632,607
cbms, a 21.2% year-on-year decline, while hardwood logs
also decreased to 11,137 cbms, down 16.9% from a year
earlier.
|


