|
Report from
Europe
European furniture production falls to a new low
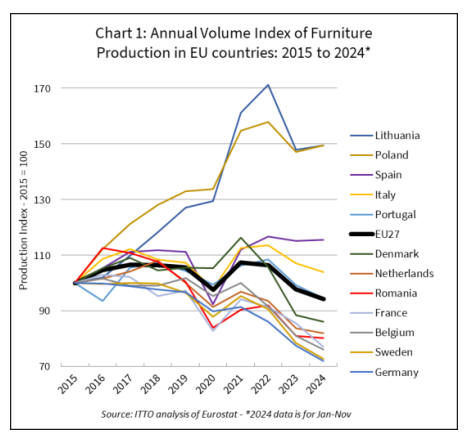
2024 was a challenging one for the European furniture
sector. According to Eurostat data the value of furniture
production in the EU27 fell 3-4%. This followed an 8%
decline the previous year. Production in the EU last year
was lower than in 2020 at the height of the pandemic
(Chart 1).
Over past two years Europe has faced increased
uncertainty, sluggish economic performance and a marked
slowdown in the construction industry. As a result,
European consumer demand for furniture has come under
considerable strain.
Despite falling inflation European furniture consumption
has continued to suffer from the erosion of household
purchasing power, the propensity for consumers to save
and the erosion of real financial wealth. Consumers are
also now more inclined to spend the disposable income
that they do have on travel and eating out, activities
precluded during the pandemic, rather than on furniture
products which they invested in heavily during 2021 and
2022 in the wake of the COVID lockdowns.
The costs of producing furniture in Europe also remained
high in 2024. High energy prices, costs of capital and
rising labour costs could not be passed onto customers,
greatly reducing profitability.
Export market competitiveness was impaired and market
prospects, particularly in the US, China and the Middle
East, were cooling and not buoyant enough to support
European production.
While the overall European trend has been sharply
downwards, furniture sector performance has varied
between European countries in recent times. Eurostat data
shows that while overall EU27 furniture production in
2024 was below the level prevailing in 2019, production in
Lithuania, Poland, Spain and Italy remains above the pre-
pandemic level. Production in the first three of those
countries increased last year.
However, production in many other countries is now well
below the pre-pandemic level and continued to decline last
year, including in Germany, Sweden, Belgium, France,
Romania, Netherlands and Denmark (Chart 2).
European furniture exports remain flat - imports rising
The latest Eurostat and UK trade data shows that European
exports of wooden furniture to countries outside the
region, after falling rapidly in 2022, remained flat
throughout 2023 and 2024. However, European imports of
wooden furniture from other parts of the world began to
increase in the second half of 2023, a trend which
continued throughout 2024.
In fact, imports from outside the region last year were
close to those at the height of the boom in 2021 and 2022.
Internal European trade in wooden furniture, which was
slowing in 2023 and the opening months of 2024, also
began to rise in the second half of last year (Chart 2).

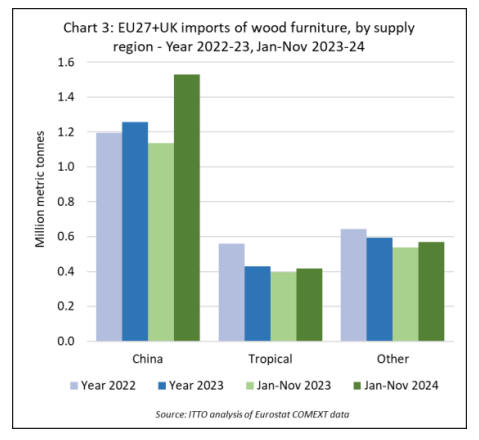
China drives rise in European furniture imports in 2024
Closer analysis of the data reveals that the recent growth
in wooden furniture imports into the EU27+UK has been
driven almost entirely by China. Imports into Europe from
China increased by 5% to 1.26 million tonnes in 2023 and
were up by more than 35% to 1.53 million tonnes in the
January to November period last year.
In contrast imports from tropical countries fell by 23% to
430,000 tonnes in 2023 and were up only 6% in the
January to November period last year. Imports from all
other countries (mainly non-EU European countries and
Turkey) decreased 8% to 590,000 tonnes in 2023 and
increased by 6% to 570,000 tonnes in the January to
November period last year (Chart 3).
Wooden furniture imports from China have increased both
into the UK, the largest single wooden furniture importing
country in Europe, and into the EU. UK imports from
China increased 13% to 417,000 tonnes in 2023 and were
up another 16% to 445,000 tonnes in the January to
November period last year. EU imports from China were
up only 3% in 2023 to 833,000 tonnes but increased 44%
to 1,090,000 tonnes in the January to November period
last year.
Imports of wooden furniture from China increased very
sharply into all the main EU markets last year including
France (+35% to 236,000 tonnes), the Netherlands (+65%
to 202,000 tonnes), Germany (+34% to 192,000 tonnes),
Spain (+46% to 82,000 tonnes), Belgium (+65% to 71,000
tonnes), Italy (+28% to 59,000 tonnes), and Poland (+40%
to 57,000 tonnes).
The rise in Chinese wooden furniture imports into
European countries in 2023 and 2024 is partly explained
by the fact that it followed a big decline in 2022 when
Chinese exports were seriously impacted by rigorous
lockdowns during the pandemic. And while high
production costs are impeding the international
competitiveness of European furniture products, the
competitiveness of Chinese products is benefiting from
continual improvements in technical performance,
manufacturing efficiency, quality management, and from
increasing investment in advertising and marketing.
The accelerating pace of imports from China during 2024,
at a time when underlying European consumption was
slow, may also be related to EUDR as European importers
were building stock before enforcement of that law was
expected to begin on 30 December 2024.
The EU has now delayed the date of EUDR application
until 30 December 2025 but that decision was only
confirmed at the very end of last year. The full impact of
EUDR on EU imports of composite products like furniture
remains to be seen but is likely to be very significant given
the challenges of meeting the far-reaching traceability
requirements.
European imports of tropical wooden furniture recover
lost ground
Following a steep decline in 2023, European imports of
wooden furniture from the largest tropical supplying
countries recovered some lost ground in 2024 (Chart 4). In
the January to November period last year, EU27+UK
imports from Vietnam were 148,000 tonnes, up 9%
compared to the same period in 2023.
Imports increased 21% to 80,000 tonnes from Malaysia
and were up 11% to 75,000 tonnes from India. However,
during the same period imports were down from Indonesia
(-8% to 63,000 tonnes), Brazil (-5% to 43,000 tonnes),
Thailand (-28% to 4,000 tonnes) and Singapore (-30% to
2000 tonnes).

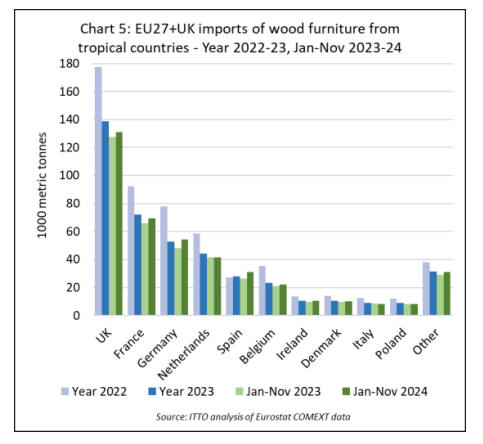
Considering European destinations for tropical wooden
furniture, after most recorded a large downturn in 2023,
there was slow recovery in all the main markets in the
January to November period last year.
For example the UK (+3% to 131,100 tonnes), France
(+5% to 69,500 tonnes), Germany (+13% to 54,400
tonnes), Netherlands (+0.1% to 41,600 tonnes), Spain
(+17% to 30,900 tonnes), Belgium (+5% to 22,100
tonnes), Denmark (+4% to 10,200 tonnes), and Poland
(+1% to 8,200 tonnes).
However, Italy recorded a 2% decline in imports of
tropical wooden furniture to 8,300 tonnes during the
eleven-month period (Chart 5).
Slowdown in internal EU furniture market dampens
global trade
Despite recent challenging market conditions, Europe
continues to hold a crucial position in the global furniture
industry, acting as a pivotal hub for production,
consumption and world trade. Valued at around US$115
billion the European market accounts for more than one-
quarter of the global world furniture market.
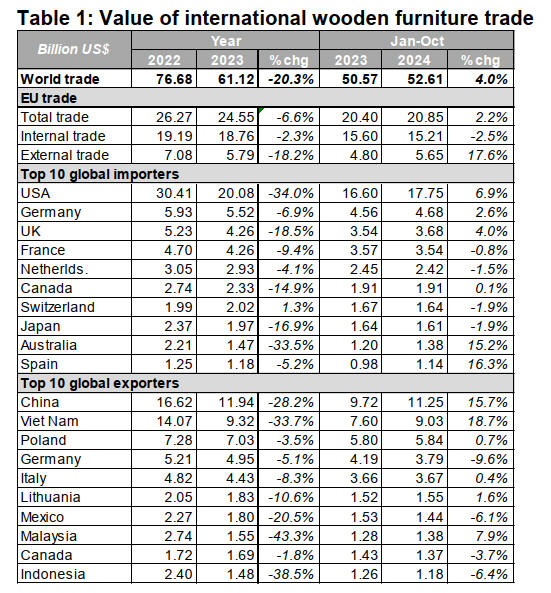
A key feature of the European furniture sector is that it is
characterised by an exceptionally high level of business-
to-business trade concentration and integration. Unlike in
the U.S. where a large share of furniture production has
been relocated to China, Southeast Asia and Mexico, 80%
of current demand in Europe continues to be met by
European manufacturers. Considering just wooden
furniture, around 40% (US$ 24.55 billion) of the total
value of world trade in 2023 (US$ 61.12 billion) involved
EU countries where there is a robust intra-regional trade
network (Table 1).
Source: ITTO analysis of www.stix.global,
Based on imports into 46 leading economies
Analysis of wooden furniture trade data shows that the
sluggish pace of EU internal trade in 2024 had a
dampening effect on global trade. In the first ten months of
2024, world trade in wooden furniture was valued at US$
52.6 billion, 4% more than the previous year. However, if
internal EU trade is excluded, the rise in the total value of
global trade was closer to 7% last year.
In the first ten months of 2024, the value of wooden
furniture imports into the EU from outside region
increased by 18% to US$ 5.65 billion.
Imports of wooden furniture products into four other
major global markets also rebounded strongly during this
period: the U.S. (+7% to US$ 17.75 billion), the UK (+4%
to US$ 4.68 billion), Australia (+15.2% to US$ 1.38
billion), and South Korea (+11% to US$ 850 million).
These positive trends were offset by a 2.5% fall in the
value of the EU internal wooden furniture trade to US$
15.21 billion, alongside a 2% fall in Japan’s imports to
US$ 1.61 billion, and a 2% fall in Swiss imports to US$
1.64 billion.
China and Vietnam, and to a lesser extent Malaysia, were
the principal beneficiaries of the overall recovery in global
wooden furniture trade in the first ten months of last year.
The value of China’s exports increased by nearly 16% to
US$ 11.25 billion, while exports from Vietnam increased
by nearly 19% to US$ 9.03 billion. Exports from Malaysia
increased by 8% to US$ 1.38 billion during the period.
|