|
Report from
the UK
Largest increase in share of EU27 tropical wood
market for at least 15 years
In 2021, logistical problems on the supply side in tropical
countries during the COVID pandemic seemed to
accelerate the long term trend away from tropical timber
products in the EU27 market.
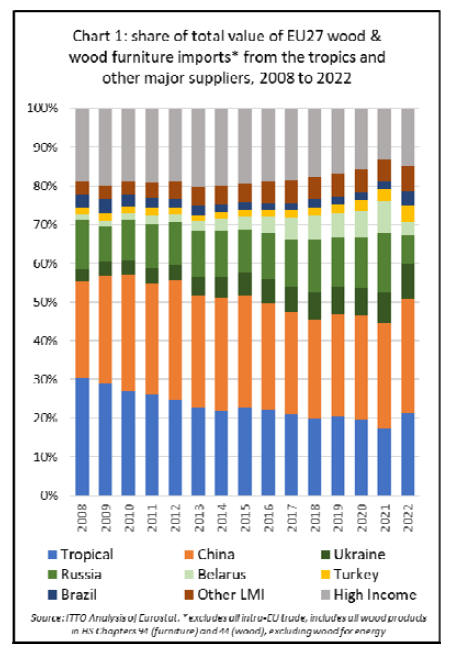
The share of tropical products in the total value of EU27
imports of wood and wood furniture fell from 20% in
2020 to just 17% in 2021.
However, last year the situation was transformed as
tropical products recorded the largest increase in share for
at least the last 15 years, rebounding to 21% of the total
value of EU27 imports of wood products and wooden
furniture (Chart 1).
The recovery in the value and share of tropical wood
products trade with the EU in 2022 was driven both by
normalisation of supply chains and falling freight rates
after the severe disruption of pandemic, together with a
sharp fall in available supply of wood products from
Russia and Belarus during the year.
In 2021, the EU27 imported wood and wooden furniture
with a total value of US$4.95 billion from Russia and
Belarus, nearly one quarter of total import value of these
products. However, this fell to just US$2.24 billion in
2022.
The EU first imposed trade sanctions on Belarus timber
products on 2 March 2022. These were extended to
Russian timber products on 8 April 2022.
On 10 March 2022, Russia’s Industry and Trade Ministry
announced a ban on all wood and timber-related exports to
"unfriendly countries", including the EU, UK and US.
Both leading certification organisations, the PEFC and
FSC, announced in March 2022 that all timber originating
from Russia and Belarus would be categorised as ‘conflict
timber’ (i.e. from a controversial source) and not eligible
to be sold and promoted as PEFC- or FSC-certified. This
had a significant impact on many European companies
which had become heavily dependent on Russia and
Belarus for their supplies of certified wood.
Of total FSC global forest area of 237 million hectares at
the start of last year, 63 million hectares (27%) was in
Russia and 15 million hectares (6%) in Belarus.
Of PEFC certified area worldwide of 328 million hectares
at the start of last year, 32 million hectares (10%) was in
Russia and 9 million hectares (3%) in Belarus.
At the start of 2023, PEFC reported no certified forest in
either Russia or Belarus.
FSC is currently reporting zero certified forest area in
Belarus but 39.5 million hectares in Russia despite the
‘conflict timber’ categorisation.
EU27 trade data indicates that these measures took time to
take effect, with timber products continuing to be imported
in significant volumes from both Russia and Belarus until
July 2022. However EU27 imports from both countries
fell to close to zero in the last five months of the year.
In value terms, tropical products were significant
beneficiaries of the sharp fall in EU27 imports of wood
products from Russia and Belarus during 2022.
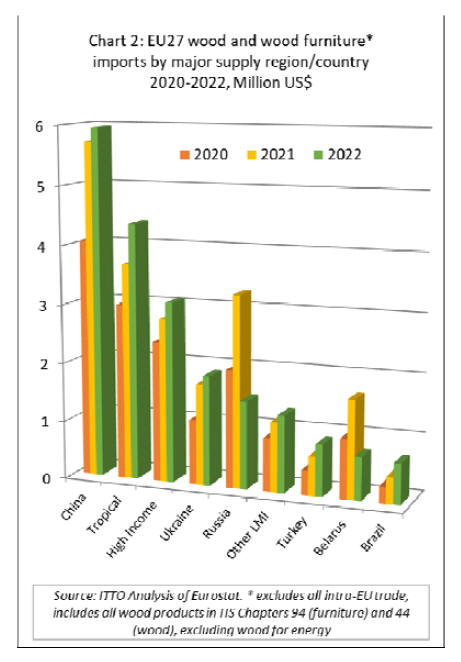
Whereas total EU27 imports of wood and wood furniture
fell 4% from US$21.2 billion in 2021 to US$20.4 billion
in 2022, imports of tropical products increased 18% from
US$3.7 billion to US$4.4 billion during the same period.
EU27 import value of wood and wood furniture from
China increased only 4% to US$6.0 billion in 2022,
although this did build on a massive 42% gain the
previous year. Import value from Ukraine also increased
by 9% to US$1.9 billion in 2022, despite the serious
disruption due to the war, following a 55% gain the
previous year.
Other significant beneficiaries were Turkey, for which
EU27 import value increased 32% to US$890 million last
year, and non-tropical products from Brazil which
recorded a 54% increase to US$ 690 million in 2022
(Chart 2).
EU27 import value from the tropics increased across all
wood product groups last year including furniture (+10%
to US$1.73 billion), sawnwood (+22% to US$904
million), mouldings/decking (+21% to US$396 million),
joinery (+27% to US$286 million), plywood (+52% to
US$254 million), veneer (+13% to US$234 million),
marquetry/ornaments (+55% to US$127 million), flooring
(+45% to US$89 million), and logs (+10% to US$65
million) (Chart 3).

EU imports of tropical sawnwood exceed 1 million
cu.m for first time since 2016
In volume terms, tropical sawn hardwood recorded a
particularly large increase in share of total EU27 imports
of sawn hardwood in 2022 (Chart 4).
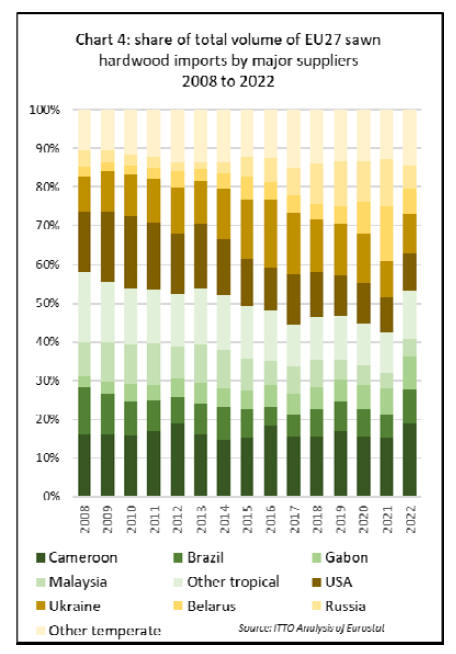
EU27 imports of tropical sawnwood increased 18% to
1.01 million cubic metres during the year, exceeding one
million cubic metres for the first time since 2016.
In contrast, EU27 imports of temperate hardwoods fell
23% to 890,000 cubic metres in 2022. The share of
tropical in total EU27 sawn hardwood imports jumped
from 43% in 2021 to 53% in 2022, the highest share since
2013.
Tropical sawnwood was by far the largest beneficiary of
the decline in share of Russian and Belarus sawn
hardwood in 2022 as other suppliers of temperate
hardwood made only minor gains.
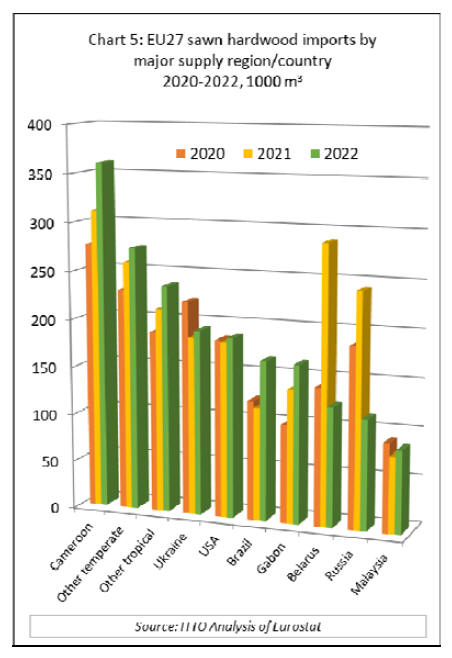
Imports from Ukraine increased just 4% to 192,000 cubic
metres, while imports from the U.S. were up only 2% to
187,000 cubic metres.
This compares to gains of 16% to 360,000 cubic metres
from Cameroon, 42% to 166,000 cubic metres from
Brazil, and 19% to 164,000 cubic metres from Gabon
(Chart 5 above).
War in Ukraine has massive impact on EU27 plywood
market
Russia's invasion of Ukraine had a massive impact on the
EU market for plywood in 2022. ITTO interviews with EU
plywood importers during the year indicated a huge rush
for products from the tropics where mills were encouraged
to ramp up production as much as possible for the EU
market. Tropical manufacturers were particularly
encouraged to launch (or relaunch) production of thicker
film-faced boards, mostly supplied to the EU by Russia in
recent years.
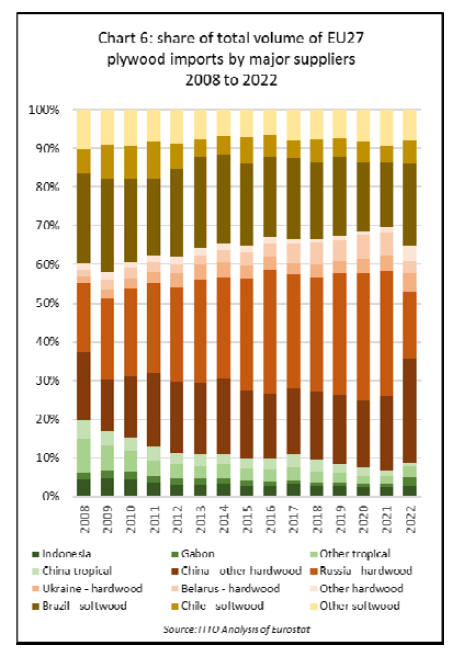
The share of tropical products in total EU27 plywood
imports, which fell to an all-time low of just 7% in 2021,
rebounded to 9% in 2022, close to the level prevailing in
the decade before the pandemic (Chart 6).
Total direct imports of plywood from the tropics increased
48% to 266,000 cubic metres in 2022, with imports from
Indonesia up 13% to 92,000 cubic metres and from Gabon
up 124% to 72,000 cubic metres.
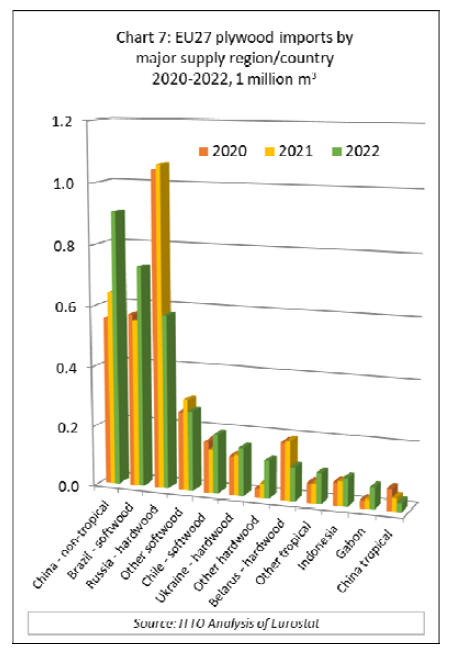
Imports of tropical hardwood plywood from China
decreased 32% to 31,000 cubic metres. In contrast to the
decline in EU27 imports of tropical hardwood plywood
from China, imports of non-tropical hardwood plywood
from the country surged 41% to 906,000 cubic metres.
Other plywood products making significant gains in the
EU27 market in 2022 were softwood plywood from Brazil
(+32% to 730,000 cubic metres) and Chile (+35% to
196,000 cubic metres), and hardwood plywood from
Ukraine (+18% to 160,000 cubic metres) (Chart 7 left).
|