|
Report from
North America
Tropical hardwood imports strong in 2022, but trended
down
While U.S. imports of tropical hardwood and related
products showed significant growth in 2022, optimism is
tempered by declining numbers over the last quarter of the
year. Import totals were up across the board in 2022 as
gains over the previous year ranged from 6% for
hardwood plywood and wooden furniture to 57% for
tropical hardwood veneer. However, imports of sawn
tropical hardwood, hardwood plywood, mouldings,
assembled flooring panels, and wooden furniture all ended
the year trending downward for each of the last three
months of the year or longer.
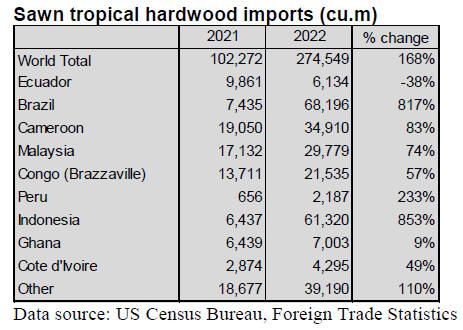
Sawn tropical hardwood imports end 2022 on weak
note
Imports of sawn tropical hardwood ended 2022 at their
lowest level of the year with volume falling for the third
consecutive month. The 17,929 cubic metres imported in
December was down 3% from November. Because the
USDA altered its categories for sawn tropical hardwood in
2021 and again at the beginning of 2022 it is hazardous to
compare 2022 data with previous years, however totals for
the year were up sharply for most woods and from most
trading countries.
The 2021 accounting depressed volume by just under half
versus the older regimen. That said, imports from Brazil
and Indonesia both rose more than 800% in 2022 over
2021 while total sawn hardwood imports rose 186%.
Imports of Padauk more than doubled in 2022 while
imports of other woods all rose sharply: Keruing (69%),
Sapelli (52%), Acajou d’Afrique (48%) and Mahogany
(44%). While imports of some woods (Jatoba, Balsa,
Virola, Teak, and Aningre) fell for the year, it is hard to
determine how much that is due to reclassification, which
led to imports of wood designated “Other Tropical” rising
more than 60-fold in 2022 and accounting for more than a
third of all imports for the year. It is certain this accounts
for most wood previously classified as Jatoba, which fell
96% in 2022 after being by far the most imported wood by
the U.S. in past years.
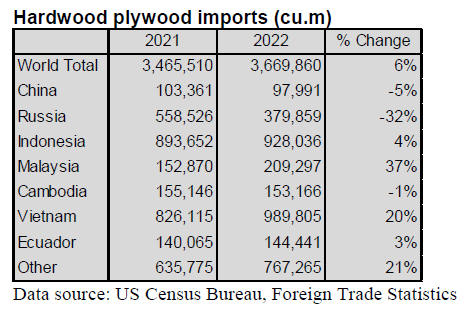
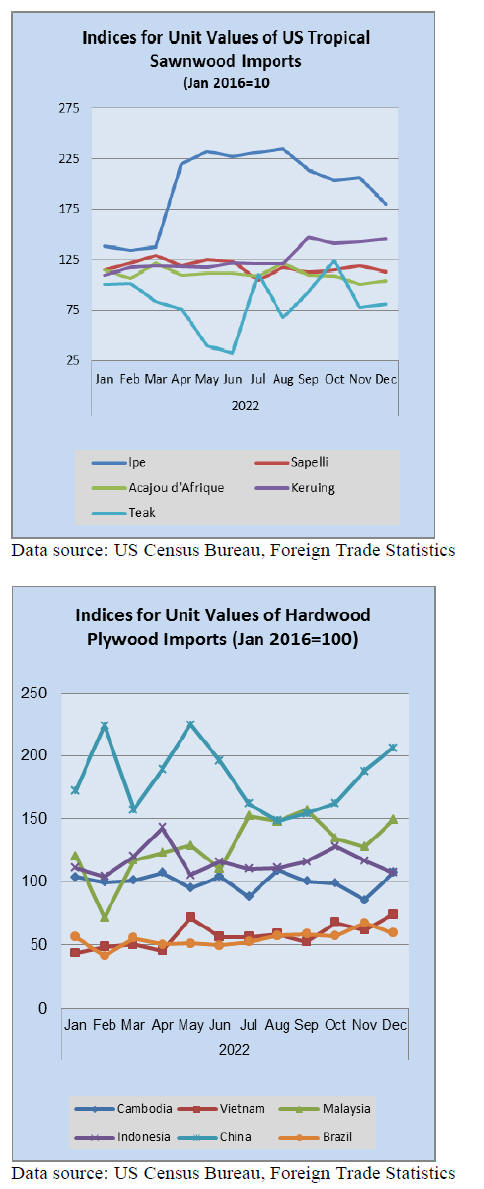
Hardwood plywood imports hit 10-year low
After sinking 20% in November, U.S. imports of
hardwood plywood skidded an additional 31% in
December to fall to its lowest level since February 2012.
The 152,707 cubic metres imported was well below half
the volume imported the previous December. Due to the
downturn, total hardwood plywood imports for 2022
exceeded those of 2021 by only 6% after being much
further ahead for most of the year.
Imports from Malaysia and Vietnam saw the most growth
in 2022, up 37% and 20%, respectively. Imports from
Russia were down 32% in 2022 while imports from China
fell 5%. The U.S. imported 3.67 million cubic metres of
hardwood plywood in 2022 with a value of US$2.85
billion.
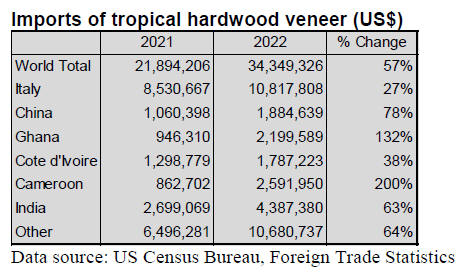
Veneer imports rose 57% in 2022
U.S. imports of tropical hardwood veneer grew by 57% in
2022 with imports from nearly all top trading partners
rising by more than 25%. Imports from Italy, which alone
account for nearly a third of all veneer imports, rose by
27% in 2022, while imports from the second largest
trading partner, India, rose 63%. Imports from Cameroon
tripled in 2022 and imports from Ghana more than
doubled.
Imports from China rose 78% in 2022 as December
imports from China hit their highest level since 2019.
Despite falling 21% in December from the previous
month, overall tropical hardwood veneer imports for the
month remained 84% higher than the previous December.
The U.S. imported tropical hardwood veneer with a value
of more than US$34.3 million in 2022.
Hardwood flooring imports showed modest gain in
2022
Imports of hardwood flooring rose 8% in 2022 as
December imports rose 2% over the previous month.
Imports from Indonesia rose more than 200% in 2022,
taking a strong bite from the market share of imports from
Brazil, which fell 10% in 2022.
Imports from Malaysia also showed a significant gain last
year, growing 53%, while imports from Vietnam fell 59%
and imports from China were off 16%. The U.S. imported
more than US$79.3 million in hardwood flooring in 2022.
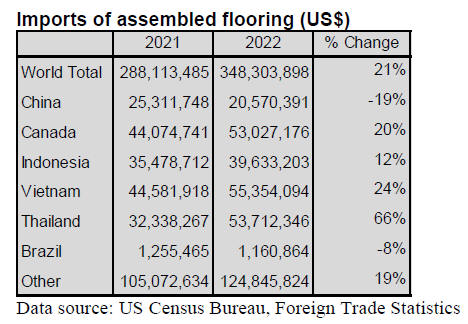
Imports of assembled flooring panels gained 21% in 2022
over the previous year as imports from Thailand rose 66%
for the year, imports from Vietnam rose 24%, and imports
from Canada were up 20%. Imports from China fell in
2022 by 19%.
Imports ended the year poorly, falling for a third straight
month in December, down 18% from November and 26%
lower than the previous December. Total imports of
assembled flooring panels reached over US$348.3 million
in 2022.
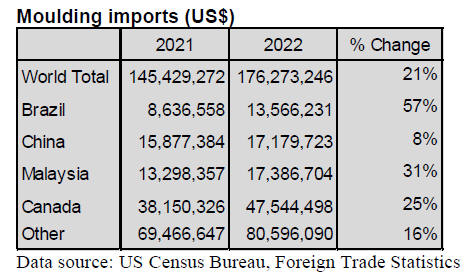
Moulding imports gained 21% in 2022
U.S. imports of hardwood moulding rose above $176
million in 2022, beating 2021 totals by 21%. Imports from
Canada, the top U.S. trading partner, rose 25% in 2022
while imports from Brazil surged 57% and imports from
Malaysia grew 31%. December numbers were
disappointing as imports fell for a third consecutive
month. December imports were down 16% from
November and 17% from the previous December as
imports from Brazil fell to a 20-month low.
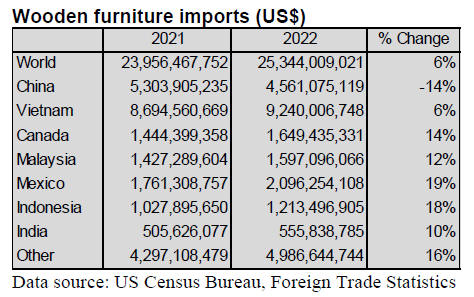
Wooden furniture imports topped US$25 billion in 2022
Despite trending steadily downward since May, U.S.
imports of wooden furniture set a record in 2022 of more
than US$25.3 billion, a 6% increase over 2021. Imports
from most trading partners rose in the 20% to 10% range
for the year with imports from Mexico rising 19% and
imports from Indonesia rising 18%.
Imports from top trading partner Vietnam rose 6% for the
year while imports from China fell 14%. Yet the outlook
for 2023 is cautious as December imports fell 5% from
November to a level 11% below that of the previous
December.
The latest Smith Leonard survey of residential furniture
manufacturers and distributors by Smith Leonard yielded
results deemed “not very pretty, yet somewhat in line with
expectations.” For the month of November 2022, net new
orders were off 35% compared to November 2021, in line
with recent results for much of the year.
But most of the recent comparisons have been to prior
year results that were not that strong compared to 2020
results. The survey reported that business is “definitely
off” with 97% of the participants reporting a decline in
orders for the month. Year to date, orders were down 34%,
and declining for 94% of survey participants.
See:
https://www.smith-leonard.com/january-2023-furnitureinsights
U.S. trade deficit at record level in 2022
The U.S. trade deficit hit a record of almost US$1 trillion
in 2022, with more than a third of the total coming from
trade with China. The annual goods and services trade
deficit rose 12.2% to US$948.1 billion, the Commerce
Department reported February 7. The goods deficit
jumped 9.3% to US$1.19 trillion, while the services
surplus declined 0.6% to US$243.7 billion.
The deficit with China was the largest, climbing $29.4
billion to US$382.9 billion. It was followed by the
European Union (EU) at US$203.9 billion, Mexico at
$130.6 billion, and Vietnam at $116.1 billion. The U.S.
recorded a trade surplus with South and Central America,
totaling US$76.2 billion, and the Netherlands at US$38.3
billion.
Imports of goods were up 14.9% to US$3.28 trillion. They
increased the most for industrial supplies and materials,
led by crude oil. Import gains were also reported for
capital goods, consumer goods, automotive vehicles, parts,
and engines, and food, feed, and beverages. Services
imports added 23.7% to US$680.5 billion, with travel and
transport higher. Exports reached US$2.09 trillion, a rise
of 18.4%, driven up by fossil fuel shipments.
See:
www.investopedia.com/us-trade-deficit-hit-nearlyone-trillion-in-2022-7106686
Disclaimer: Though efforts have been made to ensure
prices are accurate, these are published as a guide only.
ITTO does not take responsibility for the accuracy of this
information.
The views and opinions expressed herein are those of
the correspondents and do not necessarily reflect those
of ITTO
|