|
Report from
Europe
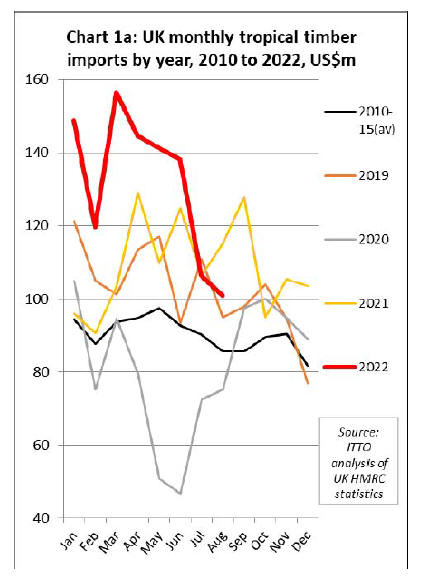
UK tropical wood product imports fell
sharply in July
and August
The import value of tropical wood and wood furniture into
the UK in the opening eight months of this year was
USD1.06B, 21% more than the same period last year.
Following the strongest start to the year in terms of UK
import value since before the 2008 financial crises,
imports fell sharply during July and August (Chart 1).
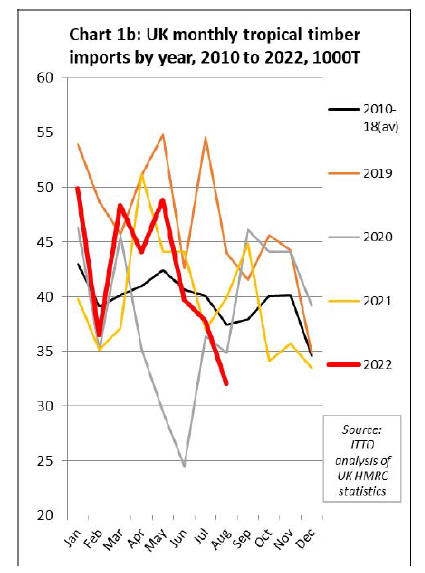
The trend looks different in quantity terms (Chart 1b).
Import quantity of tropical wood and wood furniture into
the UK in the opening eight months of this year was
337,000 tonnes, just 3% more than the same period last
year and not out of line with previous years during the last
decade.
This shows that price inflation was the major factor behind
the rise in UK import value in the first half of this year,
driven both by historically high material and freight prices
and extreme weakness of sterling against the US dollar.
The decline in UK tropical wood product imports over the
summer months was particularly dramatic in quantity
terms, with imports of only 32,000 tonnes in August being
the third lowest monthly total since August 2016. During
this six year period, monthly imports were only previously
below the August 2022 level in May and June 2020 during
the first COVID lockdown.
Dark clouds gather over UK economy
The slowdown in UK imports of tropical wood and wood
products in the summer months is unlikely to be reversed
anytime soon as market prospects have deteriorated
rapidly in the autumn months.
The latest official UK government data shows that
economic output fell 0.3 per cent in the three months to
August compared with the previous quarter during an
unprecedented period of political uncertainty and high
energy and borrowing costs.
More recent survey data shows that UK economic activity
contracted at its fastest pace in almost two years in
October, suggesting the country has fallen into a recession.
The S&P Global/Cips UK composite Purchasing
Managers Index (PMI), a measure of activity in the private
sector, dropped to a 21-month low of 47.1 in October from
49.1 in September. October’s PMI was the third
consecutive reading under 50, which indicates a majority
of businesses reporting a contraction in activity and was
below the 48.1 forecast by economists polled by Reuters.
Rishi Sunak was appointed prime minister on 25th
October following the resignation of his predecessor Liz
Truss who had been in office for only 44 days, the shortest
term of any British prime minister in history. Truss
resigned when her misfired attempt to radically reorient
the government’s economic agenda, by slashing taxes
without saying how the decision would be paid for, sent
the markets reeling.
The appointment of a new Prime Minister committed to a
tighter fiscal policy has somewhat reassured markets and
raised confidence at least of a short respite from recent
political instability. However, the sharp change of policy
also implies slower growth and higher chances of a
recession in the near-term. This means the Bank of
England is likely to be less aggressive with rate hikes.
Nevertheless, with the annual rate of inflation in excess of
10% in October, markets widely expect the BoE’s
Monetary Policy Committee to raise rates by between 75
and 100 basis points when it meets in the first week of
November. None of this is particularly positive for
Sterling which has been bumping along at close to an alltime
low of less than 1.1 to the USD since the last week of
September.
Chris Williamson, chief business economist at S&P
Global Market Intelligence, said October’s PMI data
showed “the pace of economic decline gathering
momentum” after recent political and financial market
upheaval. The economy “therefore looks certain to fall in
the fourth quarter after a likely third-quarter contraction,
meaning the UK is in recession”, he added.
The UK PMI survey, based on responses collected
between October 12 and 20, showed that new orders had
decreased at the sharpest pace since January 2021, with
panellists attributing it to the worsening economic outlook.
Manufacturers reported a particularly steep fall in new
work, with export sales falling at the fastest pace in almost
two-and-a-half years.
Business confidence also collapsed, sliding to a level
rarely seen in 25 years of survey history, with escalating
political uncertainty and rising interest rates among the
most commonly cited reasons for the downbeat sentiment.
The manufacturing sector remained in a downturn for the
third consecutive month, while the services sector reported
the first contraction in 20 months.
Williamson said that although price pressures had eased
because of the economic downturn, the weak pound and
high energy costs meant input cost inflation remained
higher than at any time in the survey’s pre-pandemic
history.
In a downbeat assessment earlier in October, analysts at
Deutsche Bank said UK GDP was due to take until 2024
to return to the level of December 2019 before the
pandemic struck.
The British Chambers of Commerce (BCC) also reported
that more than three-quarters of companies in a survey of
5,200 firms had not increased investment in the last three
months.
A rare shaft of light in all this gloom comes from the latest
S&P Global/CIPS PMI survey for the UK construction
sector. At 52.3 in September, up from 49.2 in August, the
headline construction PMI registered above the 50.0 nochange
value for the first time since June.
The latest reading was the highest for three months and
signalled a modest overall increase in construction output.
Construction survey respondents commented on a boost to
activity from work on previously delayed projects. House
building was the best-performing category in September
(index at 52.9), with growth reaching a five-month high.
Commercial work increased only marginally (51.0), while
civil engineering activity (49.6) fell for the third month in
a row.
According to S&P Global/CIPS "survey respondents often
commented on a strong pipeline of outstanding work, but
incoming new orders remained relative scarce in
September. Latest data signalled that new business
volumes were broadly unchanged overall, which
represented the worst month for new orders for almost
two-and-a-half years.
Construction firms cited slow decision making among
clients and greater risk aversion due to inflation concerns,
squeezed budgets and worries about the economic
outlook".
Flatlining UK imports of tropical wooden furniture
The UK imported USD555 million of tropical wood
furniture products in the first eight months of 2022, which
is 8% more than the same period in 2021. In quantity
terms, wood furniture imports were 114,000 tonnes during
the eight month period, 7% less than the same period last
year. This indicates that the rise in value was driven more
by price inflation than strong demand. Imports between
June and August this year were much lower than the same
period last year.
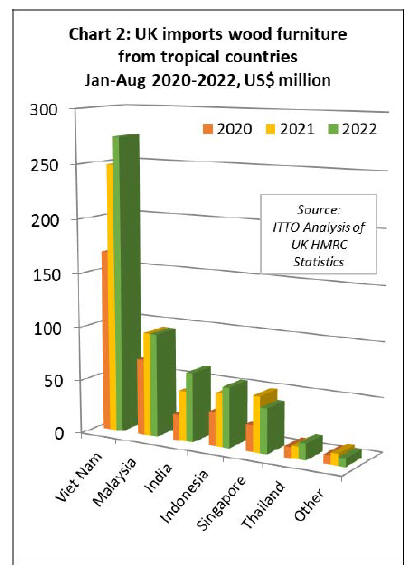
In the first eight months of this year compared to last year,
UK import value of wood furniture increased 10% from
Vietnam to USD274 million, 38% from India to USD64
million, 13% from Indonesia to USD56 million, and 32%
from Thailand to USD15 million.
Import value of USD96 million from Malaysia was the
same level as the previous year, while import value of
USD42 million from Singapore was 19% down compared
to 2021. (Chart 2).
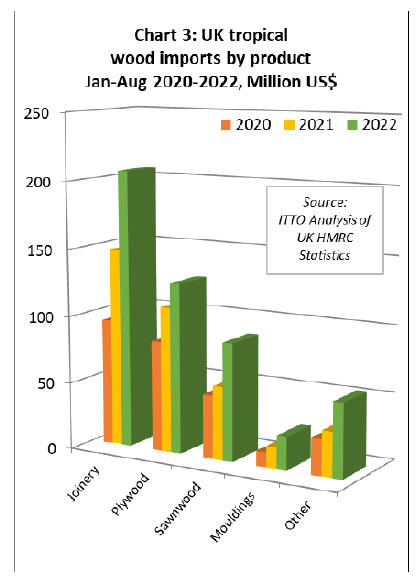
Gains in UK imports of some tropical wood products in
the first eight months of 2022
Total UK import value of all tropical wood products in
Chapter 44 of the Harmonised System (HS) of product
codes was USD501 million between January and August
this year, 39% more than the same period in 2021. In
quantity terms imports increased 8% to 223,000 tonnes
during the period.
Compared to the first eight months last year, UK import
value of tropical joinery products increased 40% to
USD207 million, import value of tropical plywood was up
17% to USD127 million, import value of tropical
sawnwood increased 60% to USD88 million, and import
value of tropical mouldings/decking increased 55% to
USD25 million (Chart 3).
Slowing pace of UK imports of wood doors from
Indonesia
As for other tropical products, the pace of increase in UK
import value of tropical joinery products slowed between
June and August this year. Nevertheless import value from
Indonesia, by far the largest supplier of tropical joinery
products to the UK (in this case mainly doors), was at
USD111 million still up 25% year-on-year in the first
eight months of 2022 (Chart 4).
In quantity terms, UK joinery imports from Indonesia
were 35,400 tonnes in the first eight months of this year,
6% more than the same period in 2021.
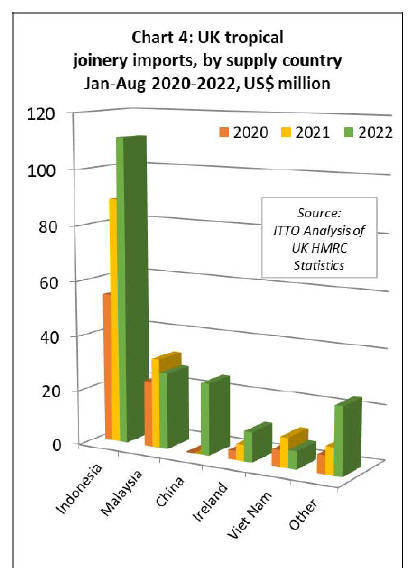
UK imports of joinery products from Malaysia and
Vietnam (mainly laminated products for kitchen and
window applications) started the year slowly and
weakened further during the summer months. Import value
from Malaysia was USD28 million in the January to
August period, 15% less than the same period last year. In
quantity terms, imports from Malaysia were 8,900 tonnes,
28% less than the same period in 2021. Joinery imports
from Vietnam of 1800 tonnes valued at USD7 million
were respectively 42% and 40% less than the same period
last year.
UK imports of Chinese tropical joinery products, nearly all
comprising doors, were 10,400 tonnes with value of
USD26 million in the first eight months of 2022, up from
negligible levels in previous years. The recorded rise was
due to introduction from 1st January 2022 of new product
codes which identify wood doors and windows
manufactured using a wider range of tropical wood species
in UK and EU trade statistics. This may also explain the
apparent rise in UK imports of tropical joinery products
from Ireland which were 1,200 tonnes with value of
USD11 million in the first eight months of 2022,
respectively 56% and 85% more than the same period in
2021.
UK tropical hardwood plywood imports switch away
from China
In the first eight months of 2022, the UK imported
154,600 cu.m of tropical hardwood plywood, 21% less
than the same period last year. Tropical hardwood
plywood imports from Indonesia, Thailand and Gabon
have made gains this year, while imports from China have
fallen dramatically, and imports from Malaysia have also
lost ground (Chart 5).
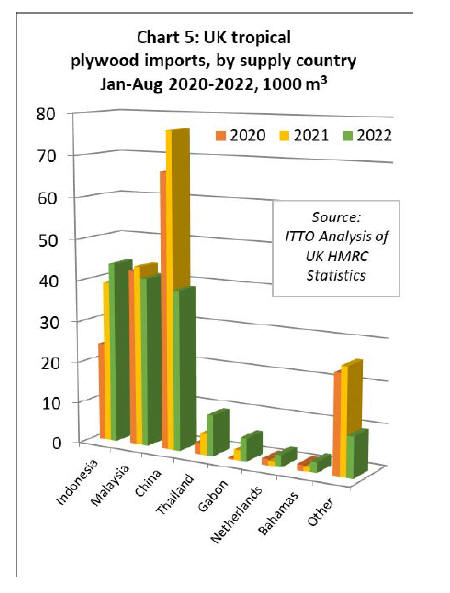
The UK imported 43,900 cu.m of tropical plywood from
Indonesia in the first eight months of this year, a gain of
12% compared to the same period last year. After picking
up pace in May this year, imports from Indonesia slowed
again between June and August. The UK imported 41,000
cu.m of plywood from Malaysia in the first eight months
of this year, 6% less than the same period last year.
Imports from Malaysia also picked up in May to their
highest monthly level for over a year but were very slow
during the summer months.
The UK imported 38,900 cu.m of tropical hardwood
plywood from China in the first eight months of this year,
49% less than the same period in 2021. Probably the
biggest shift in the UK hardwood plywood trade in the last
two years has been a rapid decline in imports of Chinese
products faced with tropical hardwoods in favour of
Chinese products faced with temperate hardwoods.
Chinese temperate hardwood plywood has been the largest
beneficiary of UK sanctions against all trade in Russian
wood products since the start of the Ukraine conflict.
Meanwhile, Brexit is impacting on UK imports of tropical
hardwood plywood from EU countries which were just
8,600 cu.m in the opening eight months of this year
compared to over 18,000 cu.m during the same period in
the last two years.
Bouyant UK imports of tropical sawnwood during 2022
Unlike tropical hardwood plywood, UK imports of
tropical sawnwood have been buoyant this year. Total UK
imports of tropical sawnwood were 74,500 cu.m in the
first eight months of 2022, 34% more than the same period
last year. In addition to making gains overall, there have
been some significant changes in the countries supplying
tropical sawnwood to the UK this year (Chart 6).
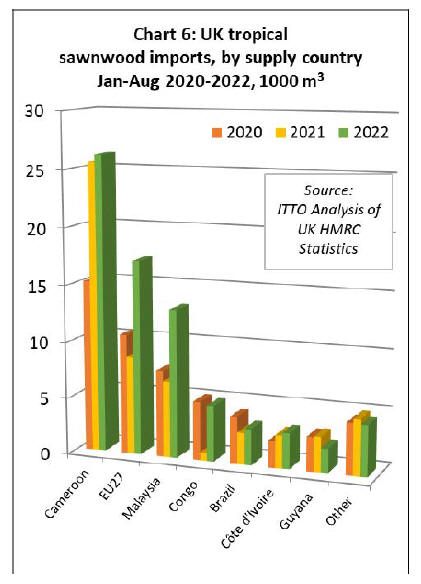
UK imports of tropical sawnwood from Cameroon were
26,200 cu.m in the first eight months of this year, 3%
more than the relatively high level in the same period last
year. UK imports of tropical sawnwood from the Republic
of Congo have recovered lost ground this year, with
imports of 4,900 cu.m in the first eight months, a 575%
gain compared to the same period last year, although still
down on the pre-pandemic level. UK imports from Côte
d'Ivoire were 3,100 cu.m in the first eight months of this
year, a 9% increase compared to the same period last year.
UK imports from Malaysia, which had fallen to little more
than a trickle in recent years, were 13,000 cu.m in the first
eight months of this year, 95% more than in the same
period last year. UK imports of tropical sawnwood from
Brazil were 3,200 cu.m in the first eight months of this
year, 14% more than the same period last year but still
down on the pre-pandemic level. Indirect UK imports of
tropical sawnwood via the EU have also recovered ground
this year despite the Brexit disruption, increasing 99% to
17,000 cu.m in the first eight months of 2022.
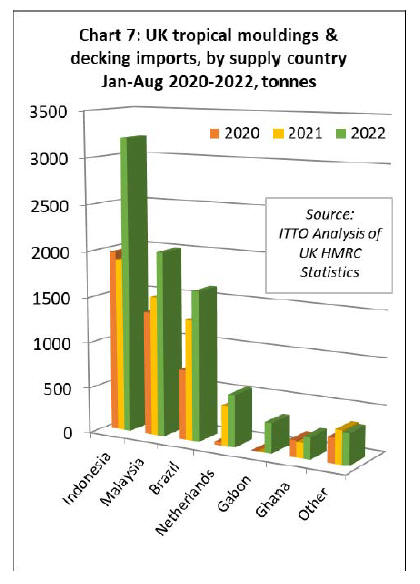
UK imports of tropical hardwood mouldings/decking were
relatively high in the first eight months of 2022, at 8,322
tonnes, 46% more than the same period last year.
This commodity group has benefited in the UK market
from shortages of non-tropical products, particularly since
the start of the war in Ukraine and sanctions on Russian
decking products that directly compete with tropical
decking.
Imports of 3,200 tonnes from Indonesia were 69% more
than the same period last year. Imports of 2,000 tonnes
from Malaysia were 32% up on the same period in 2021.
Imports from Brazil increased 24% to 1,600 tonnes during
the eight month period. (Chart 7).
|