|
Report from
North America
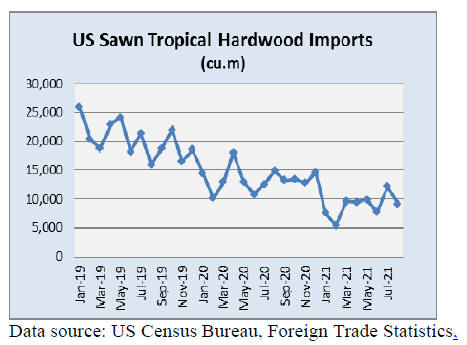
Tropical hardwood imports fell back in August
After spiking in July imports of sawn tropical hardwood
fell by 25% in August, returning to the levels seen this
spring. The 9,190 cubic metres imported is up 10% from
that of August 2020 and about 5% below the volume we
saw in March and April.
After smashing monthly records with 5,425 cubic metres
imported in July, imports fell to 783 cubic metres for
August, more in line with historic levels and about the
same level seen last August. Imports of Mahogany rose
sharply for a second straight month and are now ahead
146% year to date. Virola imports are up 47% for the year
so far after also gaining strongly in August.
Imports from Malaysia fell by 90% in August, due to
Keruing, but remain ahead 14% year to date. Imports from
Brazil rose 51% in August but are down 83% year to date,
although that may be more due to how the U.S. is now
measuring this import category than to actual imports.
Total tropical hardwood imports are down 33% for the
year so far, but that number is due to the removal of Ipe
and Jatoba totals from the category beginning this year.
When the two woods are included, US imports of sawn
tropical hardwood are up 21% so far this year versus last
year.
Meanwhile, Canadian imports of sawn tropical hardwood
fell for the fourth straight month in August. Monthly
imports dropped 5% as imports from Ghana, Brazil, and
the United States all fell sharply.
Despite the continued decline total imports for the year are
ahead 16% over last year through August.
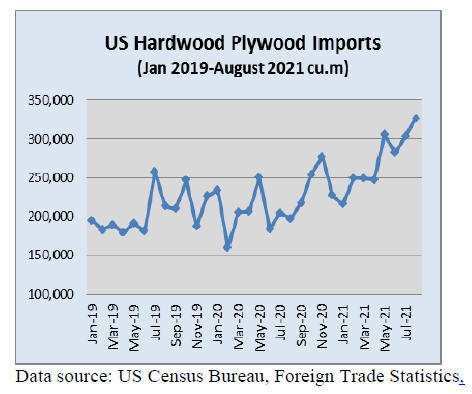
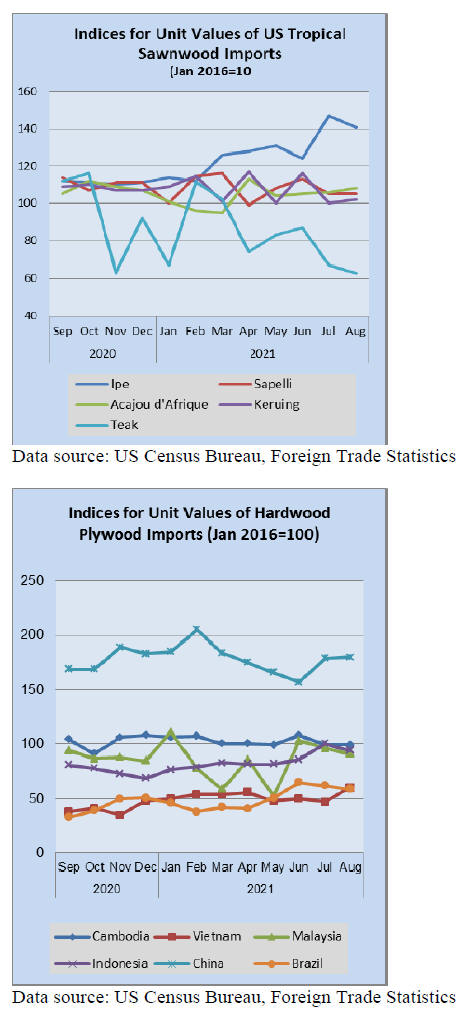
Hardwood plywood imports rise to four year high
Imports of hardwood plywood continued their rise in
August. Import volumes were up 7% in August to
326,682 cubic metres, the highest level since January
2017. Imports from Indonesia accounted for nearly onethird
of the volume, rising 72% in August.
Imports from Indonesia are ahead of last yearˇŻs volume by
54% through August. Imports from Malaysia rose sharply
in August (up 204%), while imports from Vietnam fell by
34%.
Total US imports of hardwood plywood are ahead 33%
from 2020 year to date with all major trading countries
seeing improvement over last yearˇŻs volume.
Veneer imports down 12%
Imports of tropical hardwood veneer fell for a second
straight month, dropping 12% in August. Very weak
imports from India fueled the decline. Imports from India
fell by 89% in August and were only at about 10% of the
level from August 2020.
Imports from China and Cameroon were also down for the
month and imports from all three countries are behind
2020 year-to-date numbers by more than 10%. However,
imports from Cote dˇŻIvoire and Ghana have nearly made
up for the losses.
Imports from Cote dˇŻIvoire nearly quadrupled in August
and are ahead 26% year to date while imports from Ghana
were up 41% in August and up 37% year to date. Overall
imports for the year are down 2% versus 2020 year to date
through August.
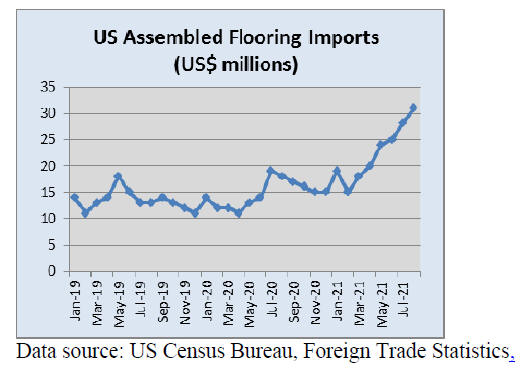
Hardwood flooring imports hit post-pandemic high
Imports of hardwood flooring rebounded in August, rising
26% to reach their highest level since 2019. Imports from
Brazil rose 39% in August to a level more than 50%
higher that the previous August and are up 116% year to
date. Imports from China and Indonesia, which have been
off for most of the year, both saw strong gains in August,
up 46% and 84%, respectively.
Imports from Malaysia fell 40% in August but were still
more than 15% better that the previous August and remain
ahead 36% year to date. Total U.S. imports of hardwood
flooring are ahead 40% year to date over 2020.
Imports of assembled flooring panels continued to expand,
rising 9% in August for a sixth straight month of growth.
Despite the growth, imports from Canada have remained
flat, rising only 2% in August and are down 1% year to
date. Imports from China and Indonesia have fueled much
of the expansion this year, but both fell in August: China
down 21% and Indonesia down 31%.
Regardless, imports from Indonesia remain up 73% year to
date while imports from China are up 34% year to date.
Imports from Vietnam were up 64% in August and are
ahead 66% year to date. Overall imports are ahead of last
year by 61% through August.
However, all year-to-date numbers should be viewed as
inflated as the USDA added two additional categories to
the Assembled Flooring Panels category in May.
Moulding imports also reach post-pandemic high
U.S. imports of hardwood moulding also hit a postpandemic
high in August, rising 9% to their highest level
since December 2018. Imports from China were
responsible for the gain, rising 71% in August for their
strongest month since imports took a nosedive in August
2020.
However, imports from China are still well below historic
levels and are down 55% year to date. While August
imports fell from Malaysia (down 29%) and Canada
(down 4%), year-to-date totals are up from both countries
by more than 40%. Overall U.S. imports of hardwood
moulding are ahead by 19% over 2020 totals so far this
year.
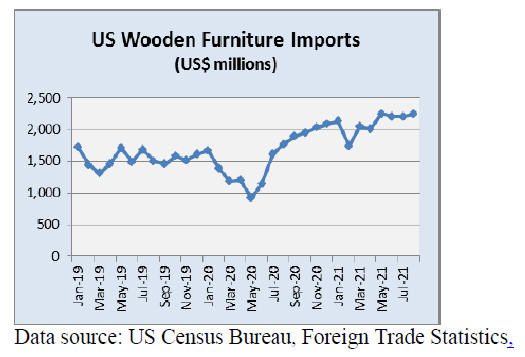
Wooden furniture imports up slightly
Imports of wooden furniture rose by 2% in August,
remaining at a historically high level. At more than
US$2.24 billion in August, imports were at a level more
than 26% higher than the previous July and at a year-todate
pace 54% above 2020.
See:https://www.woodworkingnetwork.com/news/almanacmarket-data/despite-july-drop-residential-furniture-orders-upyear-date
Imports from most countries were fairly flat, with nearly
all not raising or falling more than 5% for the month.
However, imports from Malaysia fell 32% in August while
imports from India rose 14%.
Meanwhile, new orders for residential furniture dropped
11% in July compared to a year ago, an impact of the
continuing COVID issues facing the nation, reported
Smith Leonard in the latest issue of Furniture Insights.
It marks the first time since June 2020 that new orders
were down from the same month in the previous year.
New orders were up 39% year to date through July.
Cabinet sales retreat in July
Kitchen cabinet and vanity manufacturers saw sales retreat
in July according to the latest monthly survey by the
Kitchen Cabinet Manufacturers Association (KCMA). The
KCMAˇŻs latest ˇ°Trend of Business Surveyˇ± saw overall
sales decrease 11.5% in July compared with June. Custom
sales were down 15.1%, semi-custom sales were down
17.2%, and stock sales decreased 6.6%.
However, sales remain strong in comparison with last
year. Domestic kitchen cabinet and vanity manufacturers
enjoyed a year-to-date sales increase of 18.3% through
July, compared to the same seven-month period in 2020.
Custom cabinet sales through the first seven months were
reported up 21.5% over the same period last year, while
semi-custom sales rose 17.6% and sales of stock cabinets
gained 18.1%, KCMA said.
July sales were up 7.2% compared to the same month last
year, the association added.
See:
https://www.kcma.org/news/pressreleases/July_2021_trend_of_busines_press_release
US and Vietnam reach agreement on timber sourcing
United States Trade Representative Katherine Tai said an
agreement has been reached with Vietnam that addresses
concerns regarding the use of illegally harvested timber in
products such as furniture. Thus, the U.S. will not impose
any trade-related tariffs on Vietnam relating to this issue at
this time.
|