|
Report from
Europe
Sharp fall in tropical share of European
wood products
market
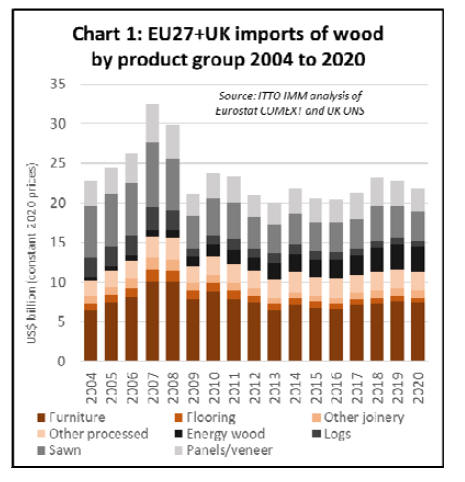
Despite upheaval in the EU27+UK wood market and
wider economy in 2020 due to the COVID-19 pandemic,
the total dollar value of EU27+UK imports of wood
(HS44) and wood furniture (HS94) products fell only 4%
to US$21.86 billion euro in 2020.
In dollar terms, EU27+UK imports in 2020 were higher
than during the 2015-2017 period and not significantly out
of alignment with the trend of the previous 10 years (Chart
1).
While the overall level of EU27+UK imports of wood and
wood furniture products remained surprisingly resilient
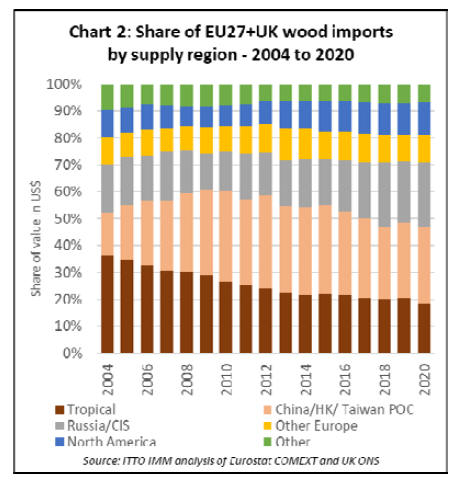
during 2020, there were winners and losers. Unfortunately
for tropical suppliers, their share of the European trade fell
sharply in 2020 after making some tentative gains the
previous year. In total, wood and wood furniture imports
into the EU27+UK from the tropics were US$4.08 billion
in 2020, 13% less than the previous year. The share of
tropical suppliers in the total value of EU27+UK wood
product imports decreased from 20.5% in 2019 to 18.5%
in 2020, the lowest level ever recorded which compares to
a figure of over 35% only 15 years before (Chart 2).
The latest downturn in tropical woodˇŻs share of the
EU27+UK market is partly due to supply side problems in
tropical countries during the pandemic, compounded by
severe lack of container space, particularly in shipments
from South East Asia to Europe.
Another key factor was that in 2020 the pandemic
impacted most heavily on a few western European
countries ¨C notably the UK, Spain, Italy, Belgium and
France ¨C which are the largest markets for tropical wood
and wood furniture products in the region.
At the same time, the largest single market for tropical
wood and wood furniture products in the region ¨C the UK
¨C went through the painful process of removing itself from
the EU, officially leaving the bloc on 31st January 2020
and the single market on 31st December after a brief
transition period last year.
In contrast to tropical countries, the total value of
EU27+UK imports of wood and wood furniture products
from China declined just 3% to US$6.18 billion in 2020,
mainly driven by a slight decline in wood furniture. This
follows marginal 1% gains in EU27+UK import value
from China in 2018 and 2019 after a period of decline
between 2014 and 2017.
EU27+UK imports of wood and wood furniture products
from CIS countries actually increased in 2020, rising 1%
to US$5.27 billion. The share of CIS countries in total
EU27+UK imports increased from 22.9% in 2019 to
24.1% in 2020. EU27+UK imports of softwood
sawnwood, birch plywood and wood furniture from the
CIS region all made gains in 2020 while imports of wood
pellets were stable. EU27+UK imports of wood and wood
furniture products from other non-EU European countries
declined 2% to US$2.17 billion in 2020 and share of
imports from these countries increased slightly, from 9.7%
in 2019 to 9.9% in 2020.
After dipping sharply early in the year, imports from
Norway (mainly softwood logs and sawnwood) and
Bosnia and Herzegovina (mainly wood furniture and some
sawn hardwood) rebounded strongly in the second half of
2020.
However, imports from Switzerland (mainly furniture and
panels), Serbia (mainly furniture), and North Macedonia
(all furniture) were recovering only slowly.
EU27+UK imports of wood and wood furniture products
from North America (excluding Mexico) decreased by just
1% in 2020 to US$2.68 billion. The regionˇŻs share of total
EU27+UK imports increased from 11.8% in 2019 to
12.3% in 2020. Rising imports of pellets offset declining
imports of sawnwood, furniture, and veneers from North
America.
EU wood furniture imports down 3% in 2020
Considering individual products (Chart 3), the dollar value
of EU27+UK imports of wood furniture decreased by 3%
to US$7.4 billion in 2020 after a 4% increase in 2019.
Wood furniture imports from temperate countries fared
much better than imports from tropical countries during
the year.
Imports of wood furniture from China, which alone
accounts for around 50% of the EU27+UK external trade,
declined only 3% to US$3.7 billion. Imports of wood
furniture from all the other leading supply countries in
temperate regions increased during the year including
Turkey (+19% to US$335 billion), Bosnia (+6% to
US$233 billion), Ukraine (+17% to US$215 billion),
Belarus (+28% to US$183 billion) and Serbia (+3% to
US$153 billion).
In contrast, there was a universal fall in imports of wood
furniture from tropical countries in 2020, including
Vietnam (-14% to US$751 billion), Indonesia (-12% to
US$367 billion), India (-6% to US$280 billion), and
Malaysia (-16% to US$222 billion).
Such consistency across the board - with rises in imports
from temperate countries matched by declines from
tropical countries - is unusual.
It may be a short-term adjustment as European importers
switched to more regional suppliers with the sharp drop in
availability of container space and rising freight rates and
other problems in sourcing products from South East Asia
during the pandemic.
On the other hand, it may have long term consequences if
it reinforces the trend towards ˇ®reshoringˇŻ and a preference
for sourcing furniture from neighboring countries in
Eastern Europe on-going now for some time in the region.
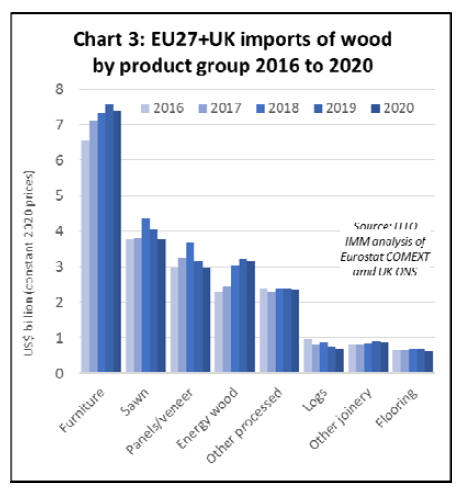
A similar trend is apparent for sawnwood. EU27+UK
imports of sawnwood (inclusive of both softwood and
hardwood, and decking) declined 6% to US$3.79 billion in
2020 following a 7% fall the previous year.
The biggest falls in sawnwood imports during 2020 were
all reserved for tropical suppliers. Imports fell 15% from
Cameroon to US$223 million, 12% from Brazil to US$237
million, 17% from Malaysia to US$117 million and 15%
from Indonesia to 114 million.
In contrast to tropical wood, imports of sawnwood from
Russia, by far the largest external supplier, recovered 9%
to US$889 million after falling 11% the previous year.
Imports from Belarus also remained quite stable in 2020,
declining only 2% to US$462 million after a 4% fall the
previous year.
Most sawnwood imports from Russia and Belarus
comprise softwood and lower value hardwood species
such as birch and aspen. EU27+UK imports of sawn wood
from both countries have been high in recent years
following imposition of log export bans.
Imports of sawnwood from Ukraine, comprising a mix of
softwood and hardwood, fell 12% in 2020 to US$310
million following a 13% fall the previous year. Imports
from the United States, almost exclusively hardwood, are
also declining, down 14% to US$291 million in 2020
following a 13% decline the previous year.
EU27+UK imports of plywood and other wood panels
decreased 7% to US$2.95 billion in 2020 after a 14%
decline the previous year.
This European market for plywood and panels weakened
sharply in the second half of 2019 with widespread reports
of overstocking and falling prices as the economy began to
cool at that time. The onset of the pandemic last year
deepened the prevailing downward trend.
With few exceptions, the downturn impacted on all the
leading suppliers of plywood and panels, both in temperate
regions and the tropics. Imports from Russia fell 5% to
US$694 million following a 14% decline the previous
year, similarly China fell 5% to US$510 million in 2020
following a 14% decline in 2019, Ukraine was down 7%
in 2019 and 1% in 2020 to US$304 million, and Brazil fell
16% in 2019 and 26% in 2020 to only US$225 million.
Of temperate suppliers, only Belarus made gains in 2020,
rising 6% to US$249 million but this followed a 19% fall
the previous year.
Amongst tropical suppliers of plywood and panels,
EU27+UK imports declined 30% to US$86 million from
Indonesia in 2020 after a 13% fall the previous year.
However, in 2020 gains were made by Gabon, with
imports rising 13% to US$110 million after a 5% fall the
previous year, and Malaysia, from where imports
increased 5%, to US$37 million, after falling 33% the
previous year.
Following nearly 20 years of almost uninterrupted growth,
the dollar value of EU27+UK imports of energy wood fell
1% to US$3.18 billion in 2020. Imports of energy wood
are now dominated by pellets from North America, Russia
and the CIS countries. Imports from the United States
continued to rise in 2020, by 3% to US$ 1.4 billion, and
also increased 25% from Canada to US$374 billion.
Imports from Russia were US$501 million in 2020, no
change compared to 2019. However, imports from Belarus
fell 3% to US$190 million in 2020. Imports from Ukraine,
which includes much charcoal as well as pellets and other
fuelwood, declined 7% to US$185 million in 2020.
EU27+UK imports of logs declined 8% to US$680 million
in 2020 after a 15% fall the previous year. In 2020,
imports fell from nearly all the countries that continue to
allow log exports, including Russia (-5% to US$290
million), Norway (-15% to US$223 million), Switzerland
(-19% to US$43 million), and USA (-15% to US$35
million).
However, after falling to negligible levels in 2018 and
2019 following imposition of tight export controls, log
imports from Belarus increased sharply last year to US$21
million.
After years of decline, EU27+UK log imports from
tropical countries are now very low and fell from all main
supply countries in 2020, down 15% from Republic of
Congo to US$18.1 million, 31% from Central African
Republic to US$6.2 million, and 44% from DRC to
US$3.7 million.
The value of EU27+UK imports of wood flooring fell 6%
to US$640 million in 2020 after a 3% fall the previous
year.
Flooring imports from China, by far the largest external
supplier accounting for around two thirds of the total,
declined 9% to US$385 million in 2020, while imports
from Ukraine were down 4% to US$97 million. However
flooring imports from Malaysia increased last year, by
25% to US$29 million. Imports from Indonesia were down
4%, to US$21 million, continuing a long-term downward
trend.
EU27+UK imports of ˇ®otherˇŻ joinery products (i.e.
excluding flooring and mainly comprising doors and
laminated wood for window frames and kitchen tops) fell
3% to US$880 million in 2020 after a gain of 5% the
previous year. Imports from China were stable at US$206
million in 2020 after rising 4% in 2019.
However, imports from Indonesia were down 16%, to
US$174 million, reversing the 9% gains made the previous
year. Imports from Malaysia also declined in 2020, by 6%
to US$95 million after rising 10% in 2019. Imports from
Vietnam increased by 1% to US$26.7 million in 2020,
building on a 14% gain in 2019.
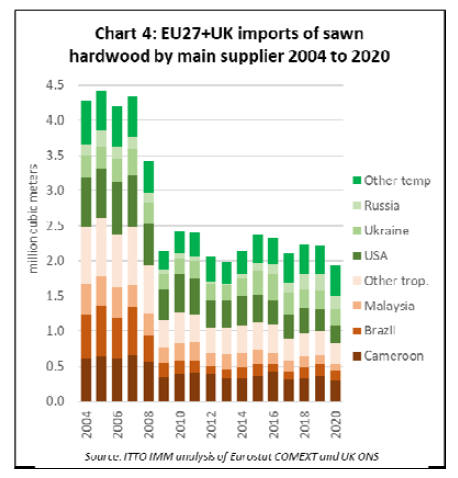
Record low EU27+UK imports of sawn hardwood in
2020
In quantity terms, EU27+UK imports of sawn hardwood
fell 13% to 1.93 million cu.m last year, the lowest level for
at least thirty years and only the second year ever
(alongside 2013 during the euro currency crises) that
imports have fallen below 2 million cu.m. EU27+UK
import quantity of tropical sawn hardwood declined 18%
last year to only 828,000 cu.m, the lowest level ever
recorded. Import quantity of temperate sawn hardwood
fell 8% to 1.11 million cu.m.
Despite the sharp decline in trade, the level of EU27+UK
sawn hardwood imports last year was not significantly out
of alignment with imports in any year since 2009. The
reality is that European sawn hardwood imports have been
stuck at historically low levels ever since the financial
crises. The decline last year is a relatively minor blip
compared to the huge 50% fall between 2007 and 2009
(Chart 4).
In quantity terms, in 2020 EU27+UK imports of tropical
sawnwood declined 17% from Cameroon to 303,000 cu.m,
25% from Brazil to 129,000 cu.m, and 13% from Malaysia
to 105,000 cu.m. Imports of temperate sawn hardwood
also declined from all leading supply countries including
the US (-13% to 261,000 cu.m), Ukraine (-17% to 224,000
cu.m) and Russia (-15% to 197,000 cu.m).
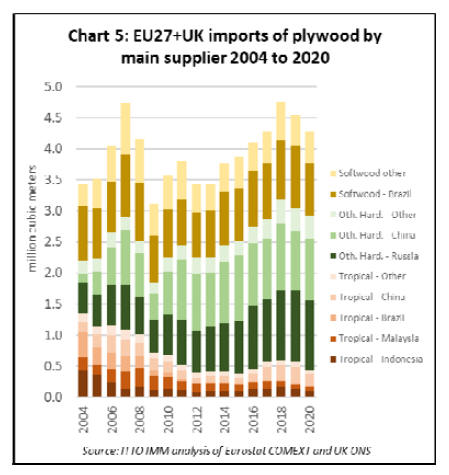
EU27+UK imports of tropical plywood down 22% in
2020
In quantity terms, in 2020 EU27+UK imports of plywood
fell 6% to 4.28 million cu.m following a 5% decline the
previous year. While EU27+UK imports of plywood
declined in both 2019 and 2020, they were still at
historically high levels, last year being the fourth strongest
year for plywood imports in the last 20 years (Chart ).
While overall EU27+UK plywood imports were strong in
2020, there was a significant loss of market share for
tropical products. Imports of tropical hardwood plywood
fell 22% to 441,000 cu.m last year and share of all
plywood import quantity declined from 12% in 2019 to
10% in 2020.
Although imports of tropical hardwood plywood increased
24% from Malaysia to 72,000 cu.m, they declined from
other leading supply countries including Indonesia (-27%
to 104,000 cu.m) and China (-31% to 187,000 cu.m).
In 2020, tropical hardwood plywood lost share mainly to
non-tropical hardwood plywood from China, including
both mixed light hardwood (comprising mainly eucalyptus
and poplar) and birch products. Total EU27+UK imports
of non-tropical hardwood plywood increased 1% to 2.49
million cu.m in 2020.
A 6% increase in imports from China to 998,000 cu.m
offset a 5% decline in imports from Russia to 1.12 million
cu.m. EU27+UK imports of softwood plywood fell 10% to
1.35 million cu.m in 2020, mainly due to a 17% decline in
imports from Brazil to 842,000 cu.m.
|