|
Report from
North America
California forest-risk procurement bill fails
The California Deforestation-Free Procurement Act, legislation which
would have required state contractors to certify that certain
commodities supplied to the state were not grown, derived, harvested,
reared, or produced on land where tropical deforestation occurred,
failed to advance out of the California Senate Appropriations Committee.
Because it was not approved by the Appropriations Committee it will not
proceed to the full California Senate and will not become law in 2019.
See:
https://leginfo.legislature.ca.gov/faces/billTextClient.xhtml?bill_id=201920200AB572
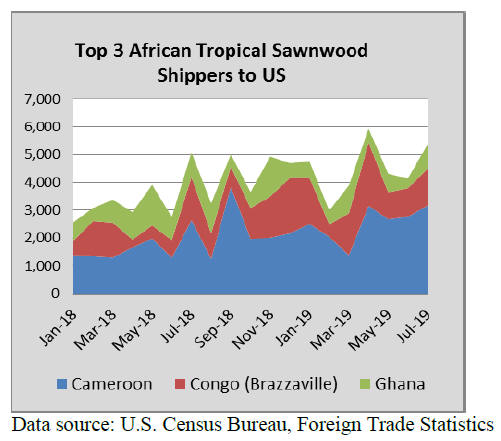
Across the board rise in sawn tropical hardwood imports
US imports of sawn tropical hardwood rebounded in July from a
weak June, climbing 18% by volume from the previous month. Imports rose
to 21,419 cubic metres in July, a volume approximately 8% higher than
that of July 2018. Import volume is ahead of 2018 by 22% year to date.
Imports gained from all leading US hardwood trading partners in July, as
each of the top 10 trading partners saw more than 10% increases. Imports
from Ecuador rose by 26% in July, but Ecuador still remains behind last
yearˇŻs volume year to date. Imports from nearly all other countries are
well ahead of last yearˇŻs totals.
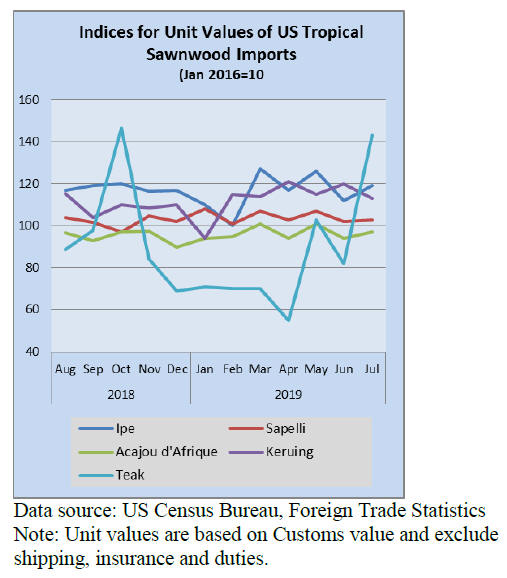
Imports of teak, acajou dˇŻAfrique, vVirola, pPadauk and keruing all rose
sharply in July and are well ahead of 2018 volume year to date.
Surge in July veneer and plywood imports
US imports of hardwood plywood surged in July to a level not
seen since last summer. Import volumes grew by 42% in July to 257,772
cubic metres, its highest monthly level since last August and 15% higher
than July 2018.
Imports from China were up only 7% in a month where volume increased by
at least 30% from nearly all other countries. Despite the strong month,
year to date volume remains down by 8% with nearly every country other
than Vietnam down more than 10% year to date. Imports from Vietnam are
more than doubling last yearˇŻs totals to date.
Imports of tropical hardwood veneer also climbed sharply in July, rising
by 68% from June. Imports from Ghana rose 150% in July to their highest
level in three years, while imports from Italy increased by 71%.
Imports from China and Cameroon continued to fall in July with imports
from both countries down 62% year to date. Despite the strong July,
total US imports of hardwood veneer are down 17% year to date.
Flooring imports from China down over 50%
US imports of hardwood flooring fell by 3% in July, declining
for a second straight month after a strong spring. While imports for
July lagged 4% behind July 2018 levels, overall imports are leading last
year by 12% year to date.
Imports from China fell 5% in July and are down 53% year to date.
Imports from Brazil fell by 34% in July but remain well above historic
levels and are ahead 153% year to date. Imports from Indonesia and
Malaysia both rose modestly and remain ahead of 2018 year to date.
Imports of assembled flooring panels fell by 14% in July. Imports from
China and Indonesia were down by more than 30%. Imports from Vietnam
rose 10% and are ahead by 151% year to date. Imports from Thailand more
than quadrupled in July after suffering two of its slowest months in
years. Overall imports are ahead of 2018 by 8% year to date.
Moulding import volumes steady
US imports of hardwood moulding are steady but at a rather low
level. July import volumes were down 1% in July as imports from China
and Brazil continued to decline.
Imports are down 27% year to date. Imports from Brazil fell by 11% in
July and are now down 49% year to date. Imports from China are down 52%
year to date after dropping 10% in July. Imports from Malaysia were up
42% in July. Imports from Malaysia and Canada are both ahead of 2018 by
10% year to date.
Domestic sales of furniture fall for 5th consecutive month
New furniture orders in June fell for the fifth consecutive
month according to the latest Smith Leonard survey of US residential
furniture manufacturers and distributors. New orders in June were 6%
below June 2018 with 64% of the participants reporting lower order
levels. June 2018 orders were up 5% over June 2017. Year-to-date, new
orders fell to 3% lower than in 2018 with 70% reporting lower orders for
the year. The 2018 year to date orders were up 6% over 2017.
See:
https://www.smith-leonard.com/2019/08/29/august-2019-furniture-insights/

|