Japan
Wood Products Prices
Dollar Exchange Rates of 25th
May
2019
Japan Yen 109.3
Reports From Japan
ˇˇ
Decline in imports tilts up GDP
growth
In the first quarter 019 JapanˇŻs economy grew at an
annualised rate of 2.1% according to Cabinet Office data,
an acceleration of growth compared to the previous
quarter. The better than expected numbers were due
largely to a sharp decline in imports, interpreted as a sign
of underlying weakness in demand. While exports rose 2%
in the first quarter the trend in consumer spending and
private sector capital investment continued to disappoint.
The weakening global economy, especially slower growth
in China, JapanˇŻs biggest market, has undermined
corporate confidence and driven down business
investment, a cornerstone of recent economic growth in
the country.
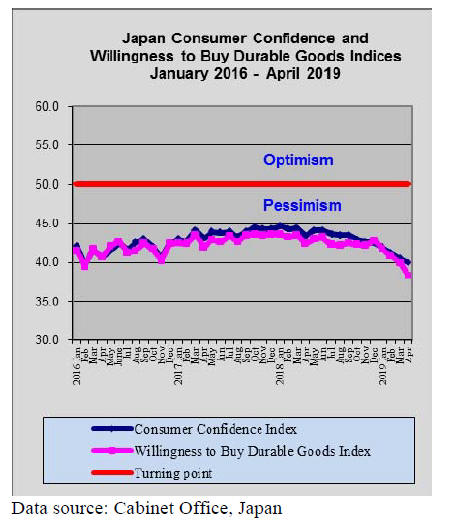
The continued down trend in consumer confidence is
reflected in weak domestic demand, something that will
weigh on the minds of policymakers as they debate
whether or not to raise the consumption tax in October.
Vital that tax be raised in October says OECD
At a press conference to launch the OECDˇŻs ˇ®Economic
SurveyˇŻ report on Japan, OECD Secretary-General, Angel
Gurria, said the increase in consumption tax scheduled for
October this year along with constrained spending is vital
if the government wishes to stabilise its budget. Japanese
government debt topped 225% of GDP in 2018, the
highest amongst members of the OECD and far exceeding
that of Greece and the United States.
The OECDˇŻs report on Japan says the impact of the 2%
rise in consumption tax ˇ°would be less intense than the
2014 3% rise because the government has plans for
offsetting fiscal support specifically aimed at supporting
domestic consumption.
The OECD also recommended that the government speed
up economic reforms to address the aging population and
women in the workplace. The OECD report supports
JapanˇŻs plan to make it easier and more attractive for
foreign workers, a major step to deal with the growing
labour shortages in Japan.
https://www.oecd.org/economy/surveys/japan-economicsnapshot/
First quarter machinery orders down 10%
The total value of orders received by top machinery
manufacturers in Japan fell just over 4% in March
compared to February. First quarter 2019 data show that
orders fell by 10.4% compared with the previous quarter.
Private-sector machinery orders, excluding those for ships
and those from electric power companies, increased a
seasonally adjusted by 3.8% in March but were also down
quarter on quarter. Manufacturers surveyed by the Cabinet
Office forecast core orders could rise over 15% in the
second quarter.
See data at: https://www.esri.cao.go.jp/en/stat/juchu/1903juchue.
html
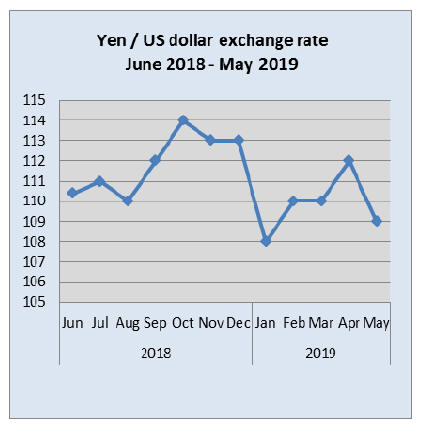
Yen strength defies Bank of Japan efforts
As the US/China trade war intensifies investors are
moving assets to safe currencies such as the yen.
In the past two weeks the yen has strengthened by almost
2% against the US dollar. The perception is that yen
strength may continue even though the Bank of Japan
maintains its current monetary policy.
However, a stronger yen undermines export prospects
while, at the same time, making imports that much
cheaper.
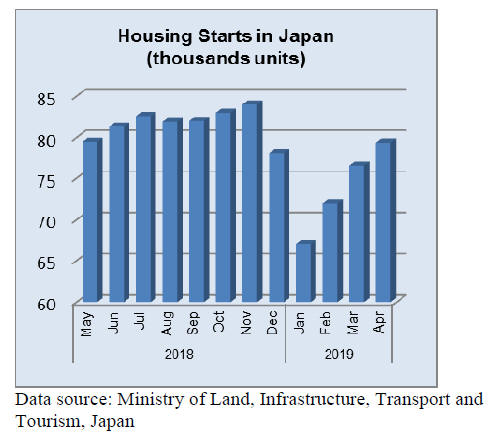
Three month of rising housing starts
April data shows a third straight monthly (4%) rise in
housing starts but year on year there was a 6% decline.
Panasonic/Toyota expand diversification in housing
sector
In a press release Panasonic, the Japanese electronics firm,
announced it will form a joint venture with Toyota and the
two will merge their respective housing businesses. The
joint venture brings together the companies' housing
subsidiaries Toyota Housing and Panasonic Homes Co. as
well as Misawa Homes Co.
The press release says globally, urban communities will
increasingly desire ˇ®connectedˇŻ life styles and homes
which are energy efficient systems and that this will be the
focus of the joint venture.
See:
https://news.panasonic.com/global/press/data/2019/05/en190509-
2/en190509-2-1.pdf
 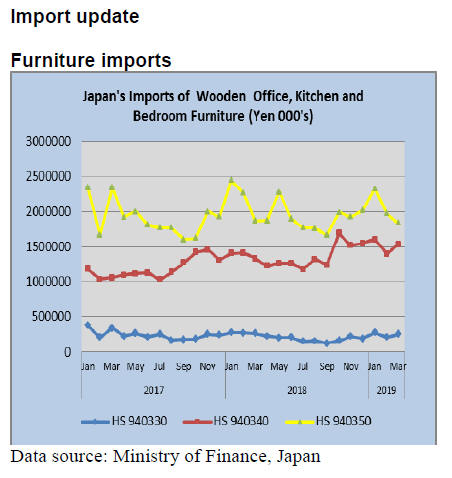
Office furniture imports (HS 940330)
First quarter 2019 wooden office furniture imports were
down around 10% compared to the first quarter 2018, this
despite a 22% rise in the value of imports in March 2019.
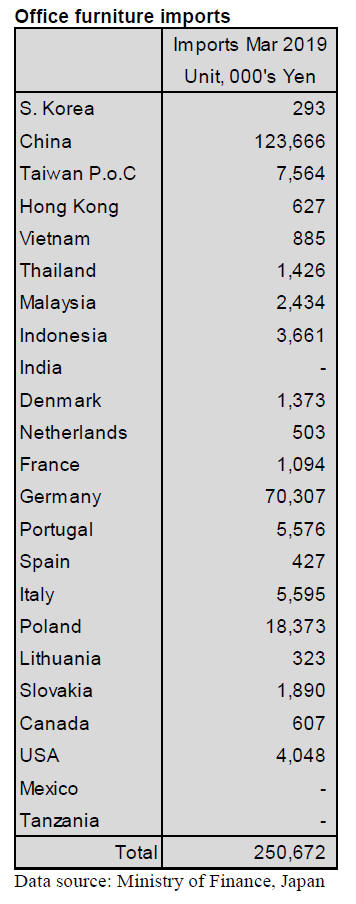
Two shippers dominated March imports, China which
accounted for 49% of JapanˇŻs imports of wooden office
furniture and Germany which contributed a further 27%. If
shipments from Poland are added to those from the two
main shippers then over 80% of imports are accounted for.
Shippers seeing a significant decline in March deliveries
to Japan include Viet Nam, Indonesia and Portugal.
Shipments of office furniture from Germany surged in
March coming in some 25 times higher than a month
earlier. The month on month value of March imports from
China was flat. Overall, year on year imports of wooden
office furniture dipped 5% in March 2019.
Kitchen furniture imports (HS 940340)
The value of JapanˇŻs first quarter 2019 imports of wooden
kitchen furniture rose 9% compared to the same period in
2018. As usual, the main shippers of wooden kitchen
furniture to Japan in March were the Philippines (49% of
all wooden kitchen furniture imports) and Viet Nam
(36%).
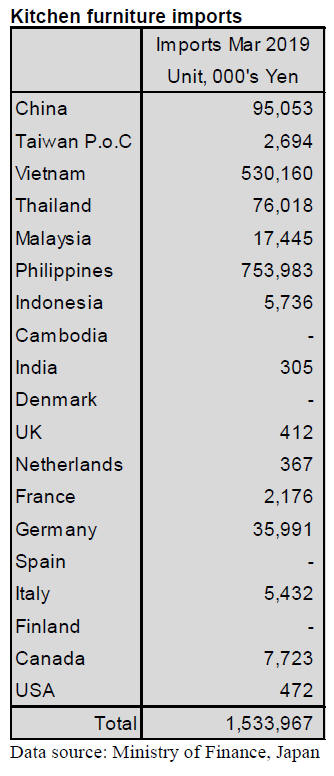
China is not a big supplier of kitchen furniture to
Japan
and in March shipments dropped sharply. As was the case
with office furniture, shipments of wooden kitchen
furniture from Germany jumped in March.
Year on year the value of March 2019 imports of wooden
kitchen furniture rose 15% and there was a 10% increase
compared to the value of February imports.
Bedroom furniture imports (HS 940350)
The decline in JapanˇŻs imports of wooden bedroom
furniture first noted in February continued into March
when there was a furthet 7% month on month decline.
This marks two months of decline mirroring the pattern of
imports seen in previous years, a rise in imports should
kick in mid-year.
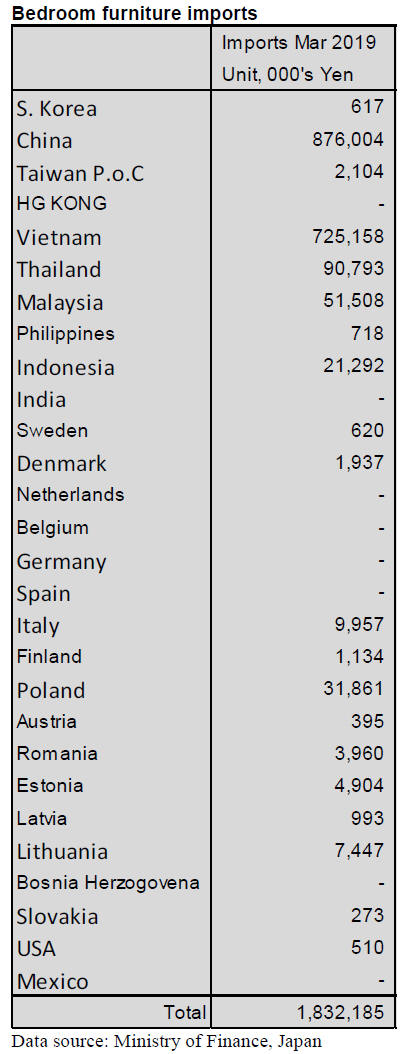
The combined value of imports of wooden bedroom
furniture from the top two shippers, China and Viet Nam,
accounted for almost 90% of March 2019 imports. The
third largest sipper, Thailand, contributed only an extra
5% to imports.
In March this year imports from China fell around 25%
compared to a month earlier and imports from Viet Nam
were at around the same level as in February. Almost all
of the other shippers saw March deliveries rise.
Year on year the value of March 2019 imports of wooden
bedroom furniture was little changed from March 2018
and there was a 7% decline compared to the value of
February imports.
Trade news from the Japan Lumber Reports (JLR)
The Japan Lumber Reports (JLR), a subscription trade
journal published every two weeks in English, is
generously allowing the ITTO Tropical Timber Market
Report to reproduce news on the Japanese market
precisely as it appears in the JLR.
For the JLR report please see:
http://www.nmokuzai.
com/modules/general/index.php?id=7
Wood supply statistics in 2018
The Ministry of Agriculture, Forestry and Fisheries
disclosed wood supply statistics of 2018. Total wood
supply for lumber, plywood and wood chip in 2018 was
26,545,000 cbms, 0.3% more than 2017.Supply of
imported logs was 4,905,000 cbms, 3% less. North
American logs, New Zealand logs and South Sea logs
decreased.
By use, supply for plywood was 5,287,000 cbms, 5.7%
more than 2017 in which domestic wood increased by
9.0% to 4,492,000 cbms. Plywood mills operated
smoothly without much trouble in 2018 then Nisshin
started new plywood mill.
By species, cedar was 2,851,000 cbms, 9.2% more then
cypress was360,000 cbms, 18.8% more. In 2019, Shinyei
PlywoodˇŻs Ohita plant and KeytecˇŻs Yamanashi plant will
start up so supply of domestic wood will increase further,
getting close to 5,000,000 cbms.
Total of imported wood for plywood was 795,000 cbms,
9.9% less. Russian logs increased by 9.4% but North
American logs decreased by 12.1% and South Sea logs
also decreased by 1.5%. The largest decrease was New
Zealand logs by 45.5%. Russian logs covered shortage of
North American logs (Canadian Douglas fir logs), which
prices soared and the supply was tight in competition with
booming North American demand.
Wood supply for lumber was 16,672,000 cbms, 0.8% less.
Domestic wood was 12,563,000 cbms, 0.5% less while
import wood was 4,109,000 cbms, 1.5% less. Import of
lumber in 2018 was 5,968,000 cbms, 5.6% less. Shipment
of domestic lumber was 9,202,000 cbms, 2.7% less.
Since KD lumber shipment was 3,930,000 cbms,
unchanged from 2017 so green lumber for construction
was the main decrease. Green lumber supply for public
works and crating increased. Number of sawmill was
4,582 in 2018, 232 down from 2017. Small sawmills
continue quitting while large mills get larger. 73% of log
consumption was by large mills with power output.
Domestic lumber production of laminated Lumber
The Ministry of Agriculture, Forestry and Fisheries
disclosed domestic production of structural laminated
lumber in 2018. It was 1,852,000 cbms, 0.3% less than
2017. By size, large size decreased by about half. Medium
size decreased by about 10% then small size increased
more than 50%.
Imported structural laminated lumber in 2018 was 813,215
cbms, 6.3% less than 2017 so total supply of structural
laminated lumber in 2018 was 2,665,215 cbms, 2.2% less.
Production of CLT was 14,000 cbms.
In domestic production, large size was 27,000 cbms,
50.9% less than 2017. Medium size was 784,000 cbms,
9.4% less. Small size was 1,041,000 cbms, 11.0% more.
Others like interior finishing and decorative lumber was
71,000 cbms, 37.2% less so total production of laminated
lumber was 1,923,000 cbms, 2.4% less.
Consumption of lamina was 2,691,000 cbms, 2.3% less.
By source, domestic was 1,051,000 cbms, 15.7% more and
the import was 1,640,000 cbms, 11.2% less. Domestic
share increased to 39.1% from 33.0% in 2017. Obviously
domestic cedar lumber increased.
Total supply by size including imports is 27,804 cbms of
large size, 50.6% less, 1,138,956 cbms of medium size,
7.7% less and 1,498,445 cbms of small size, 4.4% more.
Domestic production of small size increased but imports
decreased by 7.9%.
The market of structural laminated lumber in 2018 was
inactive through whole year so despite high imported
lamina cost, market prices did not climb to cover the high
cost.
Whitewood laminated post supply increased since 2017
then by reduced imported post, the market recovered in
late 2018 and the market prices were up some after
inventory adjustment was made but the market prices are
not high enough to cover high cost.
Redwood laminated beam market was bullish in early
2018 then the supply increased and the market skidded in
spring. Inventory of imported redwood laminated beam
increased in the second half of the year so the prices
dropped. Number of laminated lumber manufacturing
plant was unchanged from 2017 at 165 then CLT
manufacturing plant was nine, two more then 2017.
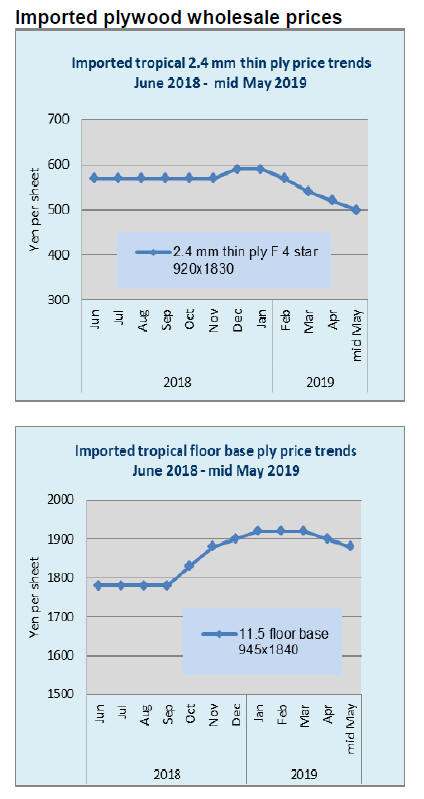
Plywood
Movement of both domestic and imported products has
been stagnating. Large precutting plantsˇŻ operations were
active in April so market recovery was expected but
lengthy holidays started before market got active so
trading firms are worried about downside of the market in
May with lower prices and the manufacturers try to tighten
the market while the market prices are softening.
March plywood production was 275,000 cbms, 0.5% less
then March last year and 4.3% more than February.
Softwood production was 263,200 cbms, 1.3% less and
r.1% more.
Shipment of in March was 256,200 cbms, 1.8% more and
1.4% more. March end inventories were 124,100 cbms,
7,000 cbms more than end of February.
Movement of imported plywood is stagnating and the
prices are weakening after some trading firms
offered low prices of 12 mm panels to reduce on-hand
inventories in March for book closing.
The inventory of distributing dealers is increasing due to
confusion of warehouse management by increased
container shipments and uneven mixture of imported
items. 12 mm panel is not particularly heavy in inventory
but 12 mm is easy to market so low price of 12 mm is
confusing the market. The importers try to restructure the
market since April but it is not easy when the demand is
weak.
Tokyo Metropolitan government allocates
larger
budget for wood use
For 2019 budget, the Tokyo metropolitan government
intensifies utilization of local wood and allocates total of
1,620 million yen, 5.6 times more than 2018 budget. It has
started subsidising to put up wooden fence when concrete
wall of public schools and private residence are removed.
It also promotes using wood fence made by locally
produced wood when concrete block wall of public
facilities is removed.
It allocated 170 million yen for wooden table, bulletin
board and outdoor bench in public facilities including
2020ˇŻs Tokyo Olympic facilities. It encourages to use
wood produced in Tama area of Tokyo.
550 million yen is allocated for exterior wall and other
exterior use, which needs to use 30% or more of Tama
wood. It also gives financial support if public schools use
wood for any part of the facilities.
Issue of domestic wood supply
Stock of timber in Japan has been increasing year after
year and recent investigation reveals is 5.2 billion cubic
meters. In this planted timber is 3.3 billion cbms, almost
doubled in 30 years. The administration says resources
have matured. 85% of planted timber is more than forty
years and well matured for harvest. However, log demand
in 2017 was 29,520,000 cbms, only 0.9% of total stock.
Therefore, expansion of log demand is urgent issue so the
administrations have been supporting capital investment of
wood processing facilities and development of demand.
Now in some areas where new sawmills and plywood are
built, log supply shortage is occurring so the voices are
saying there is enough capital investment and no need to
stimulate log demand but expansion of log supply is
necessary.
Ideal plan is that log and lumber prices climb by
increasing demand, which stimulate log supply then
number of workers for log harvest and log processing
facilities increase, which vitalize local economy.
Since 2017, many lumber mills, plywood mills, laminated
lumber mills and biomass power generation facilities have
started up one after another so log prices climbed but log
supply did not increase to satisfy expanded demand and
log supply shortage escalated in many areas. Log shortage
will get worse since there are more new log consuming
facilities after this year.
The largest reason of supply shortage is labor shortage.
Many forest workers are aged and have been retiring while
young workers are not enough to fill the gap of retired
workers. High performance forest harvesting machines
have been introduced and logging road system has been
developing but shortage of absolute numbers of workers
make it hard to utilize such machines efficiently. Such
machines attract young workers so this is one of effective
measures to draw young workers for forest business.
Workers engaged in forest harvest in 2015 were 20,910,
2,241 increase in ten years but it is less than half of 1985.
Workers engaged in replantation in 2015 were 19,400,
75% less than 1985 and less than half of 2000. If clear
cutting system continues, replantation would be way
behind cutting.
Another reason is recent trend of increasing clear cutting,
which requires replanting and clearing under bush. This
takes workers from harvesting works.
Increasing number of biomass power generation plants
impacts supply of low grade logs for sawmills. For fuel, C
class small logs are used. This used to be used for wood
chip for paper manufacturing plants and some selected
logs are sent to sawmills to produce low priced disposable
type lumber like crating and lumber supporting concrete
forming panels.
This type of lumber has demand all the time so log
suppliers made such sorting as long as the prices are
higher than wood chip. Now biomass plants use large
volume of logs for fuel and log suppliers prefer to send all
type of low grade logs direct to biomass plants rather than
sorting for sawmills.
Now low grade lumber manufacturing sawmills suffer log
shortage critically. If this trend continues, such sawmills
are forced to quit and low grade, low priced lumber supply
would stop so log supply shortage is likely to cause
shrinkage of wood demand.
Large users of domestic wood are categorized into three.
First is lumber mills. Second is plywood mills and LVL
plants. Third is wood biomass power generation plants.
In last several years, large sawmills, which consume more
than 100,000 cbms annually, have been built one after
another.
Large sawmills need large amount of logs but log supply
is not even all through a year and it fluctuate by the
season. Since log quality is inferior during summer months
so log supply decreases in summer months and the log
prices tend to climb. Thus, unlike plywood and biomass
business, lumber business suffers periodical log shortage
by season.
Plywood mills have established stable log supply structure
with local forest unions. Softwood plywood made by cedar
has been main material for structural panel then in recent
years, new demand like floor base, and concrete forming
has been increasing. For these, various different species
are required such as cypress, fir and larch.Fir is mainly
produced in Hokkaido.
This is highly demand for floor base but he supply is
limited and ships to transport logs to main-island are hard
to come by. Larch also grows in limited area and demand
for lumber is very strong so it is chronically short in
supply. Cypress is easy to obtain during harvest season but
it becomes hard to find during rainy season of June and
July because log suppliers reduce the harvest when logs
are easy to deteriorate.
Problem of biomass is utilization of unused fiber left in the
woods such as branches, roots and chunks. These are
original idea of biomass fuel when FIT started but it takes
a lot of labor to get them out so it is costly as fuel so the
plants tend to use thinning, low grade small logs, imported
wood chip and PKS, which are more economical than
fiber left in the woods. Future issue is how leftover fiber
can be removed and distributed economically.
In total stock of planted timber of 3.3 billion cbms, cedar
is 1.9 billion cbms, 57.6% in total. Cypress is 738,980 M
cbms, one fourth of cedar and larch is 223,580 M cbms.
Assuming all of 3.3 billion cbms is harvested at any
desired time, can log demand be satisfied ? First is prices.
Prices are not always agreed with timber owners then type
of logs users demand is not always same by species and
size of logs.
With new demand like biomass power generation and log
export, any type logs can be sold at 6,000-8,000 yen per
cbm but once the prices exceed 8,000 yen, type of logs to
meet this high price is limited.
Like cedar logs with more than 30 centimeters in diameter,
it is hard to market while timber keeps growing so
percentage of large diameter logs is increasing.
In stock of cedar of 1.9 billion cbms, 46-65 age class is
1.173 billion cbms, 60% of total. Therefore, it is urgent
issue to find market of larger diameter cedar logs.
Plywood mills can use larger logs now but the prices may
be same as small cedar logs so this may not be the solution
unless log suppliers are willing to accept low prices.
|