Japan
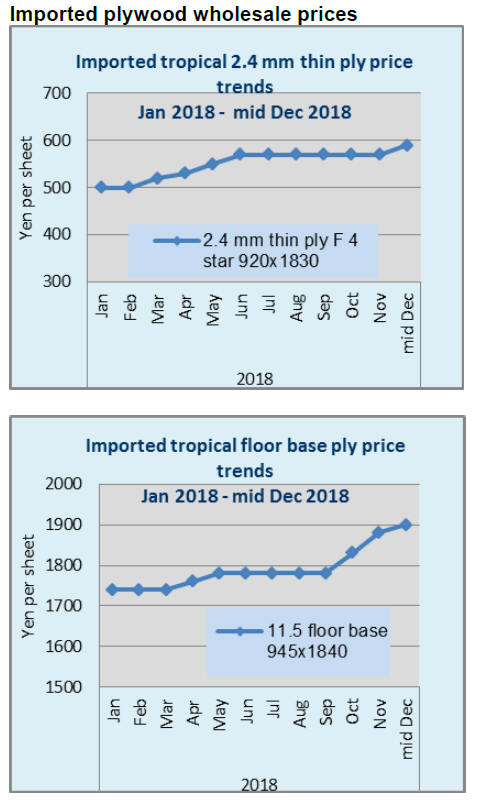
Wood Products Prices
Dollar Exchange Rates of 10th
December
2018
Japan Yen 113.34
Reports From Japan
ˇˇ
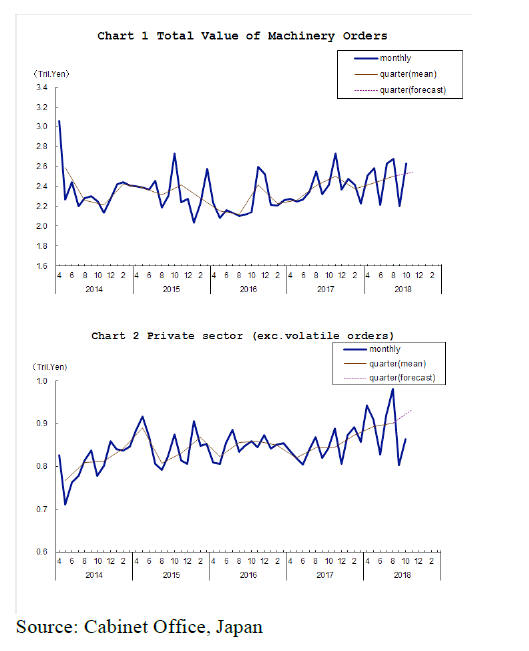
GDP likely to be lower than
forecast
The latest data on manufacturing activity is showing that
in November the pace of expansion was at its slowest for
the past 12 months suggesting fourth quarter GDP may be
lower than forecast. In related news, corporate spending,
while still expanding, is showing signs of tapering off.
See:
https://www.esri.cao.go.jp/en/stat/di/di-e.html
While corporate investment by large and medium sized
companies continued to rise in the October-December
quarter according to the Cabinet Office a recent Reuters
poll is showing that most Japanese firms expect weaker
domestic growth next year amid concerns over the impact
of the US/China trade dispute and the governmentˇŻs plan
to raise the consumption tax.
See: https://www.reuters.com/article/us-japan-companies/japanfirms-
see-trade-war-sales-tax-pressuring-economy-in-2019-
idUSKBN1O52MN
Dark clouds on the horizon
Revised data shows that Japan's economic growth declined
at an annualized 2.5% in the third quarter 2018 the biggest
drop since the third quarter of 2009. Companies have been
cutting back on investment in anticipation of a tough year
ahead.
As the Japanese economy is very sensitive to export
performance, companies are seeing dark clouds on the
horizon in the form of escalating trade friction between the
US and China.
An alternative view is provided by Robert Carnell, Chief
Economist and Head of Research at ING based on data
provided in the recent Tankan survey from the Bank of
Japan.
The fourth quarter Tankan depicts a brighter picture of
steady economic activity in sharp contrast to the weak
third quarter GDP figures. This is interpreted as indicating
an underlying strength of the Japanese economy.
See: https://think.ing.com/articles/japan-tankan-survey-not-bad/
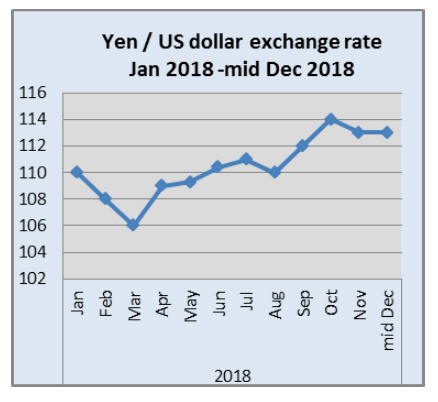
Importers alert - Stronger yen likely in
2019
The Japanese yen/US dollar exchange rate has remained
rather stable for the most of 2018 largely because the Bank
of Japan (BoJ) has successfully held off any appreciation
and because the US dollar has been steadily strengthening
due interest rate increases in the US.
Many observers are now anticipating a change to a
stronger yen driven by changes in policies at the BoJ
which is slowly stepping back from its easy monetary
policy to bring it more in line with the policies of other
central banks.
Such a change will inevitably lead to a stronger yen and
several analysts are now forecasting that, in the medium
term, the yen could strengthen to as much as yen 105 to
the dollar from the current yen 112-3 to the dollar.
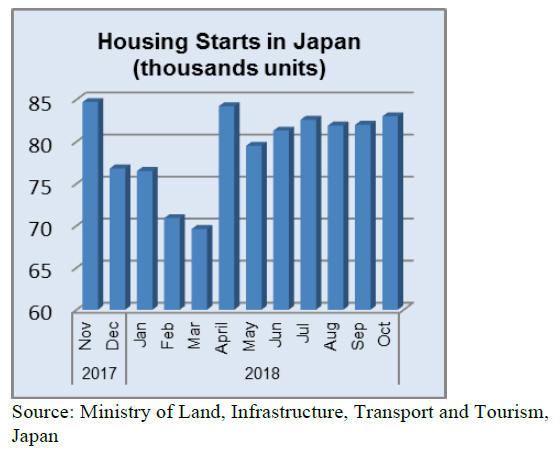
Abandoned homes - even in urban areas
In previous reports mention has been made of the millions
of unoccupied houses across Japan especially in rural
areas. Recent reports have pointed out that, even while
house prices in the cities may be rising here also, there is
also a problem with abandoned homes.
This situation, according to an article in the Japan Times,
has become so acute that some local authorities have
decided to offer subsidies to owners to tear down the old
maybe derelict home and build anew.
Furniture imports
The third quarter of a year traditionally marks a turning
point for JapanˇŻs imports of wooden furniture.
In every year since data has been provided in this report
wooden furniture imports to Japan dip in the first two
quarters of the year and reverse direction in the middle of
the second quarter and an upward trend is generally
recorded into the final quarter of the year. This trend is
already emerging for 2018.
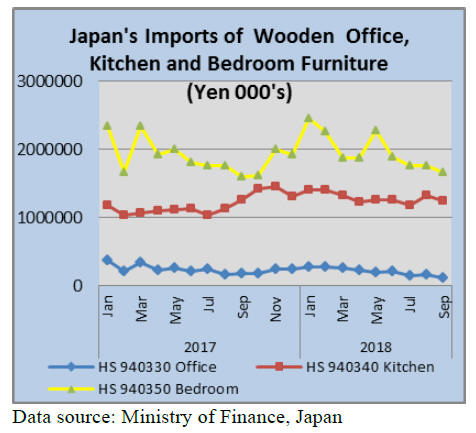
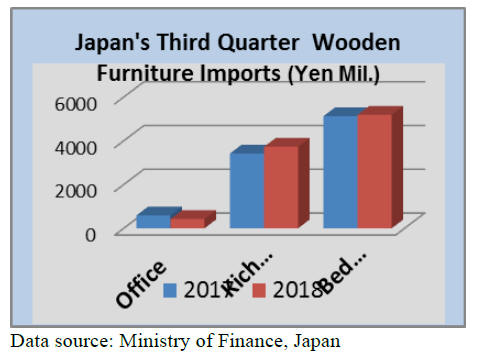
Third quarter wooden furniture imports
Year on year, third quarter 2018 imports of wooden office,
kitchen and bedroom furniture are little changed. For the
third quarter of 2018 the value of wooden office furniture
imports accounted for around 7% of the total for the three
categories in the graphic below.
Wooden kitchen furniture was the second highest in terms
of import values accounting for a further 37% while
wooden bedroom furniture accounted for over half of all
imports.
In the third quarter 2018 imports of wooden office
furniture were down 28% year on year, wooden kitchen
furniture imports were up 8% while the value of third
quarter 2018 wooden bedroom furniture imports were little
changed from a year earlier.
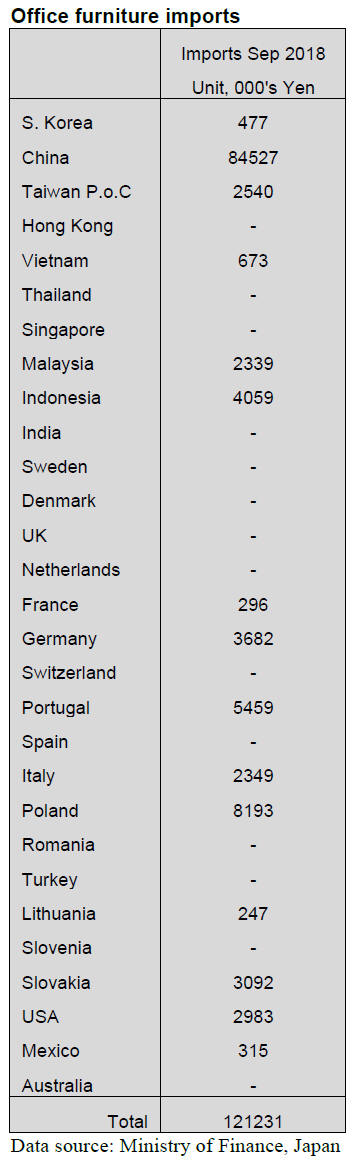
Office furniture imports (HS 940330)
JapanˇŻs September 2018 imports of wooden office
furniture (HS 940330) declined a massive 30% year on
year and were also down 23% from a month earlier. This
trend mirrors the level of imports in the same period in
2017.
The top three shippers of wooden office furniture
(HS940330) to Japan in September were China (70% of all
September imports) followed by Poland (7%) and Portugal
(5%) which translates into the top three shippers providing
82% of all wooden office furniture imports in September.
Shipments from China were up 20% in September and
Indonesia saw a quadrupling of the value of exports to
Japan. The losers in September in terms of shipment
values were Italy where exports to Japan were halved and
the US where there was a significant drop in the value of
shipments.
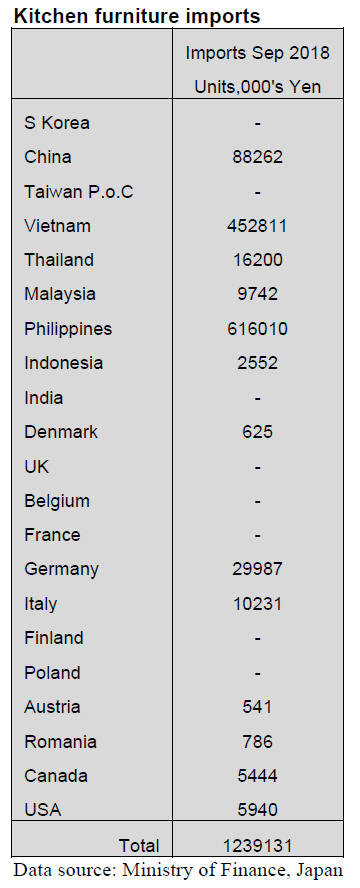
Kitchen furniture imports (HS 940340)
For almost the whole year to September 2018 two shippers
have dominated JapanˇŻs imports of wooden kitchen
furniture, the Philippines and Vietnam.
Shippers in the Philippines accounted for half of JapanˇŻs
imports of wooden kitchen furniture in September 2018
with shippers in Vietnam providing another 37%. The
third largest shipper China could only secure a 7% share
of imports in September.
Year on year, September 2018 imports of wooden kitchen
furniture were flat but month on month there was a decline
in the value of imports with all major shippers
experiencing a downturn. Shipments from China dropped
27%, shippers in Malaysia saw a 17% decline and both
German and Italian shippers experienced a roughly 25%
drop.
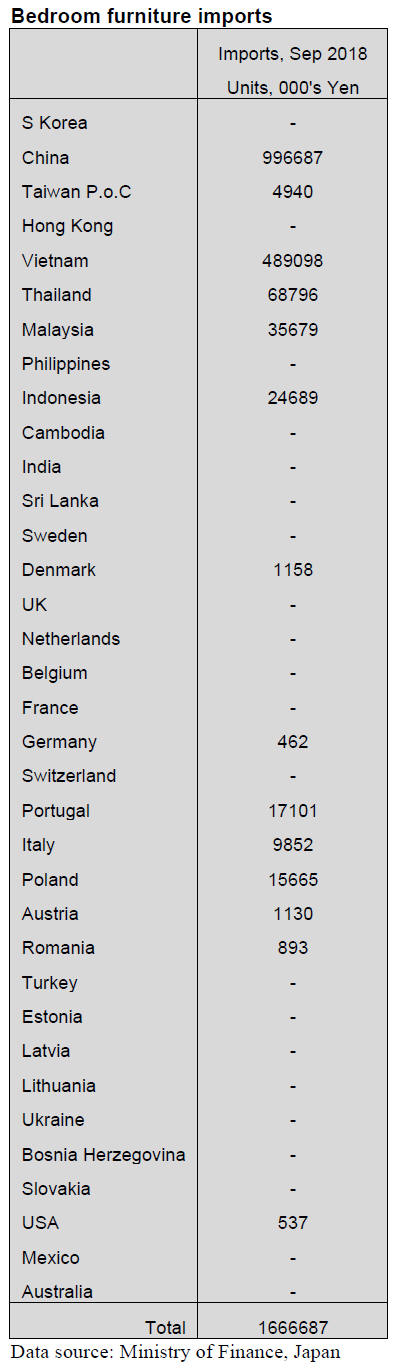
Bedroom furniture imports (HS 940350)
Contrary to the expectation that JapanˇŻs imports of
wooden bedroom furniture had bottomed out in July there
was a continuation of the downturn in imports in August
and also into September 2018. Looking at the trend in
past years wooden bedroom furniture imports are set to
rise significantly in the final quarter of the year.
In September year on year imports of wooden bedroom
furniture were little changed but September import values
were down 5% from levels in August. As in previous
months China and Vietnam dominate JapanˇŻs import
sources for wooden bedroom furniture.
Together these shippers in these two countries accounted
for 90% of JapanˇŻs wooden bedroom furniture in
September.The value of September shipments from
exporters in China was higher than in August but there
was a slight drop in the value of shipments from Vietnam.
The big winners in September were exporters in Indonesia
whose exports of wooden bedroom furniture rose over
30% in September. Arrivals of wooden bedroom furniture
from Portugal were also higher than in recent months as
they were from Indonesia. The losers in September were
shippers in Poland (a 50% drop) and Lithuania.
Trade news from the Japan Lumber Reports
(JLR)
The Japan Lumber Reports (JLR), a subscription trade
journal published every two weeks in English, is
generously allowing the ITTO Tropical Timber Market
Report to reproduce news on the Japanese market
precisely as it appears in the JLR.
For the JLR report please see:
http://www.n-mokuzai.com/modules/general/index.php?id=7
Utilisation of domestic large diameter logs
Plantation of domestic forest of Japan started after the war
and trees have kept growing and now average diameter of
harvested logs get larger.
Utilisation started to deal with small thinning at first then
next step was to deal with logs with top diameter of 16-18
cm then 24-28 cm to recover post and stud. Sawing has
been based on cutting small logs to recover one piece of
post so it is ˇ®chip and sawˇŻ type machines. Main log sizes
sawmills are cutting have been 24-28 cm of top diameter
and logs over 30 cm have to be sawn by head rig on
carriage then slabs go to edger or gang saw to recover
smaller lumber.
After 50 years after plantation started, trees get bigger and
log size is larger so sawing needs to change to deal with
larger diameter logs. Particularly in Southern part of Japan
like Kyushu where growth is faster.
In Miyazaki prefecture in Kyushu, clear cutting has been
standard while other regions had selective harvest and
according to the Forestry Agency, total harvest of
Miyazaki in 2017 was 1,964,000 cbms of which cedar was
1,810,000 cbms. The prefectural institute reveals that
assuming annual harvest of cedar continues with
2,000,000 cbms, more than half of logs would be over 60
years old.
Trees in fast growing regions are soft with coarse grain so
it is hard to recover valuable grade of lumber so together
with sawing larger logs, it is necessary to find market of
lumber recovered from large logs. Advantage of larger
logs is to recover large size lumber like beam but warping
and bending then dimensional stability by drying remain
as problem.
In Northern Japan, trees grow slower so that grain is tight
and quality lumber without knots and heart center can be
recovered from slabs but fast growing cedar is different.
2x4 lumber may be possible and crating lumber to replace
high priced radiate pine logs then purlin and girder to
replace high priced North American softwood lumber may
be other options.
Plywood is another possibility. For plywood mills, peeling
one large log is more efficient than peeling two small logs
but again warping by drying veneer is problem to solve.
At present, log export market is the only market to
appreciate large diameter logs. China market uses cedar
logs for non -construction like crating, lamina for interior
use and public works so strength is not necessary.
It sounds ridiculous but actually prices of larger logs are
lower than smaller logs now. In Southern Kyushu market,
prices of 3 meter cedar logs with diameter of 24-28 cm are
13,100 yen then 36-38 cm are 11,500 yen, 1,600 yen
down. 4 meter log prices are the same.
South Sea (tropical) logs
After Sabah, Malaysia banned log export since last May,
South Sea log supply was expected to drop but import
from PNG increased so that total year log supply would be
the same as last year. For the first nine month, log supply
from PNG is 48,000 cbms, 37,000 cbms from Sabah and
25,000 cbms from Sarawak so PNG is the top supply
source now.
However, main species in PNG is mersawa, which is
higher in price than Malaysian logs and freight is higher so
plywood mills in Japan face tough choice. They wish to
buy Sarawak logs but it is a pipe dream because even local
plywood mills in Malaysia cannot have enough logs to
produce export plywood.
US and China trade war on wood products
Since September 24, U.S. imposed 10% duty on Chinese
wood products while China imposed 5 or 10% duty on
American wood products except for 25% on Southern
Yellow Pine. For China, wood products supply from the
U.S. is about 10% and can substitute from other sources.
Meantime, Chinese furniture manufacturers suffer higher
cost of hardwood lumber from the U.S.A.
For U.S. side, logs and lumber export for China increased
considerably in last three years so decline of export may
influence forest products suppliers. What kind of influence
would this cause to Japan market is various. Since China
became large wood importing country, China needs to
look for substituting sources.
China is large importing country of southern yellow pine
logs. If this declines, China would buy more New Zealand
radiate pine logs, Russian logs or Japanese cedar logs to
replace. Next concern is if the U.S. would increase duty to
25% since 2019.
Total trade amount in 2017 from China to the U.S. US$
506.5 billion (14.3% of total trade amount of China) and
from the U.S. to China is US$130.8 billion (16.3% of total
trade amount of the U.S.A.). This tells bullishness of the
U.S.A.
In wood products trade, import of China is 55,400,000
cbms of logs, 37,390,000 cbms of lumber. This is
130,000,000 cbms in log basis. There is almost no log
import to the U.S. and lumber import mainly from Canada
is 29,800,000 cbms. Plywood import by the U.S.A. is the
largest in the world with 12,880,000 cbms.
China has practically no export of logs and lumber but
plywood export is the largest in the world with 14,760,000
cbms in 2016.
With domestic plywood production being 170,000,000
cbms, export volume is less than 10% of production. Also
export of furniture by China is the largest in the world.
U.S. has very little plywood export main exporting items
are 11,470,000 cbms of industrial logs and 6,750,000
cbms of lumber.
In wood products trade, the amount of wood products
trade from the U.S. to China is about US$3.2 billion and
that from China to the U.S. is about US$3.9 billion.
Noticeable change is that the amount from the U.S. to
China has kept climbing year after year during 2015 and
2017. US$2.0 billion in 2015.US$ 2.5 billion in 2016 and
US$3.2 billion in 2017. Both logs and lumber increased.
Amount lumber increased from US$1.1 billion to US1.7
billion and logs increased fromUS$ 900 million to
US$1.4 billion in three years.
Amount of items exported from China to the U.S. is
almost all finished products like furniture, which takes
about half then plywood, particleboard and wooden board
take about one third. According to the announcement by
China, total export amount of wood products in 2017 is
US$36,250 million dollars so US$3.9 billion is about 10%
for the U.S. export.
Main export item from the U.S. to China is softwood logs
of 4,840,000 cbms, 6.9% more than 2016. By species,
hemlock is 1,200,000 cbms, southern yellow pine is
870,000 cbms, Douglas fir is 670,000 cbms, spruce is
580,000 cbms and cedar is 3,000 cbms.
In these hemlock is flat and Douglas fir is declining but
southern yellow pine sharply increased in last three years.
It was only 200,000 cbms in 2015 then 870,000 cbms in
2017, four times more than 2015. This may be the reason
that the duty rate is 25% on southern yellow pine only
while others are 10%.
In lumber export of 3,250,000 cbms, softwood lumber is
only 850,000 cbms so balance is all hardwood lumber for
furniture and flooring manufacturing. In softwood lumber,
southern yellow pine lumber is 413,527 cbms, almost half
of softwood lumber. Main species of hardwood lumber are
oak and ash.
Furniture export is main item for China. Both U.S. and
China target hardwood and furniture as higher duty items.
China imposes 10% duty on both hardwood logs and
lumber but initially China suggested 25% on oak, 20% on
cherry and ash so the rate may be raised to this level since
2019. U.S. imposes 10% duty on Chinese furniture but if
things do not improve, it will be raised to 25%.
In log import, volume of hemlock and spruce for China is
more than Japan. Hemlock logs for China in 2017 was
1,204,785 cbms, 13.1% less than 2016 and spruce was
581,525 cbms, 11.7% less. China volume of hemlock is
75.0% in total hemlock export and of spruce is 35.3%. If
demand in China declines, U.S. hemlock log suppliers
may have a hard time to find low grade log market.
Plywood export from China to the U.S.A. has been
increasing by about 10% every year. About 1,680,000
cbms in 2014. About 1,840,000 cbms in 2015 and about
2,050,000 cbms in 2016. The volume is more than three
times compared to the volume from China to Japan. U.S.
plywood industry complained that subsidy by the Chinese
government is the reason of increase and by this sharp
increase of import, U.S. domestic plywood millsˇŻ
operation dropped by about half.
The Department of Commerce admits that it is unfair
dumping by China and ITC supports this so that since
December 2017, maximum of 183.36% of anti-dumping
duty plus 22.98-194.9% of countervailing duty for subsidy
are imposed.
The volume from China sharply dropped after this.
Chinese plywood manufacturers are shifting to supply
base to South East Asian countries now.
|