|
Report from
Europe
Subdued EU tropical timber imports in 2018
EU imports of tropical wood products have been subdued
so far in 2018 with little sign yet of any rebound from the
downturn in 2017.
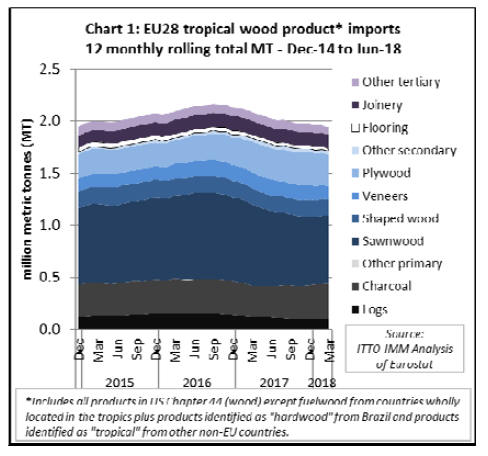
Chart 1 (above) shows twelve monthly rolling total
imports (to iron out seasonal fluctuations) into the EU of
all tropical wood products listed in HS Chapter 44
(excluding fuelwood, wood waste and chips).
It shows that imports peaked at an annualised level of 2.17
million metric tonnes (MT) in September 2016, slipped to
a low of 1.94 million MT in March this year and had
recovered only slightly, to 1.98 million MT by June.
In total, the EU imported 1.06 million MT of tropical
wood products in the first half of 2018, 1.6% more than
the same period in 2017. The total value of EU imports of
tropical wood products in the January to June 2018 period
was €1.10 billion, 3% less than the same period in 2017.
Although there have been gains in EU imports of tropical
sawnwood, charcoal, mouldings and joinery products this
year, these have been offset by a large decline in imports
of tropical veneers, flooring, and other tertiary products,
and a more moderate decline in imports of tropical
plywood.
Deteriorating economic conditions in the EU
Economic conditions in the EU have deteriorated since the
start of 2018 and are acting as a drag on hardwood
consumption. EU economic growth was slower than
expected in the first quarter of 2018.
At the time, policy makers were quick to dismiss this as a
temporary blip, mainly due to severe winter weather.
However, when economic activity in the second quarter
also fell below expectations, it became clear that more
persistent factors are impeding growth.
In Germany, domestic orders for manufactured goods are
currently running at 3% below a year ago and export
orders growth is close to a standstill.
The slowdown is made more worrying for occurring
before the planned withdrawal of the European Central
Bank (ECB) super-stimulus programme. In June, the ECB
confirmed that it intends to end this programme, which
involved bond-buying to the tune of €30bn every month,
in December. ItˇŻs disappointing that growth has remained
sluggish in the euro-zone despite the mighty boost from
low interest rates and a cheap euro exchange rate.
Other storm clouds are gathering which may threaten
longer-term growth in the European economy. Several
large European banks are heavily exposed to the economic
turmoil in Turkey.
The Brexit negotiations have not progressed as well as
hoped and the odds are rising of Britain quitting the EU
with no deal, which will be costly for both sides.
In Italy, the new Eurosceptic government is threatening to
pass a budget in October that will put it on a collision
course with eurozone spending rules, with uncertain
economic and political consequences for the whole bloc.
These concerns are mirrored in the European
CommissionˇŻs latest GDP growth forecasts published in
July. After expanding 2.2% in 2017, GermanyˇŻs GDP
growth is forecast to slow to 1.9% this year and to grow at
the same rate in 2019.
FranceˇŻs economy will grow 1.7% this year and next,
much below the 2.2% growth from last year. The slowestgrowing
economy of the bloc will remain Italy, which is
expected to grow only 1.3% this year, down from 1.5% in
2017, and to further slow to 1.1% in 2019.
Only the UK is expected to match Italy in sluggishness of
growth among all the 28 states of the European Union. It
is expected to grow only 1.3% this year, a big drop from
the 1.7% GDP rise recorded last year.
EUTR impacts on tropical wood imports
The obligation placed on importers by the EU Timber
Regulation (EUTR) to gather data to demonstrate a
negligible risk of illegal harvest is acting as an extra drag
on EU trade in tropical timber.
Reports suggest regulatory actions are becoming more
frequent and vigorous, particularly in Belgium in recent
weeks. This is more significant given the important role
Belgian importers play in distributing tropical hardwood
products to other parts of the continent.
There appears to be a general trend in the EU for many
companies that formerly imported direct from the tropics
to avoid the need to implement EUTR due diligence
systems by procuring through other EU companies.
This is concentrating trade in the hands of a few of the
larger EU importers who, in turn, are limiting their
purchases to a smaller number of tropical suppliers
capable of providing the legality assurances required by
EUTR.
Overall, opportunities for tropical exporters to enter the
EU market are therefore becoming more restricted.
As the only country delivering products with FLEGT
licenses, which are not subject to any further EUTR risk
mitigation measures, unlike other non-EU countries
Indonesia may be expected to benefit from this more
active enforcement of EUTR.
There is some evidence for this. The EUˇŻs total imports of
tropical wood products from Indonesia increased 7% to
175,000 MT in the first 6 months of 2018, and IndonesiaˇŻs
share of total EU tropical imports increased from 15.7% to
16.6% in the same period, mainly at the expense of
Cameroon and Gabon.
While EUTR may now be favouring Indonesia in the EU
market, other supply side factors are also playing a role.
As noted in the last market report, supplies of African
hardwood species of interest to the EU market are in long
term decline, while exports from African have been
seriously affected by logistical challenges at the port of
Douala in Cameroon and cash flow problems of large
European operators, issues brought to a head with the sale
of RougierˇŻs subsidiaries in Cameroon and the Central
African Republic in July.
Supplies of both Malaysian and Indonesian products were
also restricted in the first half of 2018, largely attributed
by European importers to the long and severe wet season
and its impact on harvesting and log transport, with mills
consequently running short of logs. This fed through into
rising prices.
Plywood prices for both Malaysia and Indonesia in the EU
increased by 30% in the six months between October 2017
and March 2018.
Meanwhile a larger share of African supply is now being
exported to China, Vietnam and other emerging markets.
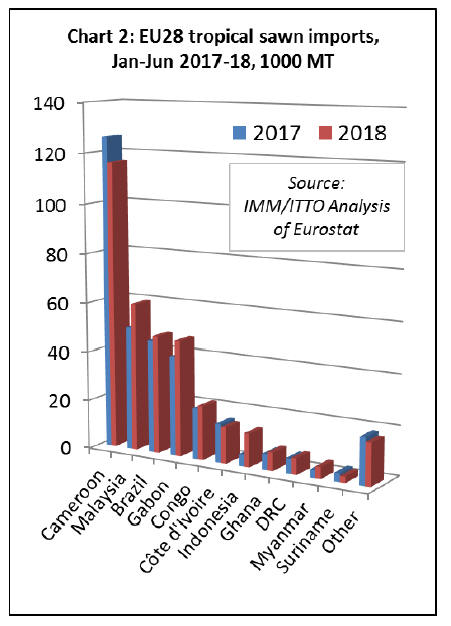
5% rise in EU imports of tropical sawnwood.
EU imports of tropical sawnwood increased 5% to
359,300 MT in the first half of 2018. Import value also
increased, by 7% to €366 million.
Although imports continued to slide from Cameroon (-8%
to 116,100 MT) and Côte d'Ivoire (-7% to 14,700 MT),
this trend was offset by rising imports from Malaysia
(+19% to 59,800 MT), Brazil (+4% to 47,700 MT), Gabon
(+16% to 47,000 MT), Congo (+6% to 21,900 MT),
Indonesia (+186% to 13,500 MT) and Ghana (+16% to
7,500 MT). (Chart 2).
The rise in imports from Indonesia, which only allows
exports of S4S lumber, may be partly due to alterations in
the HS codes used to record imports from Indonesia
following introduction of FLEGT licensing.
The rise in EU imports of sawnwood from Indonesia is
offset by a similar decline in imports of mouldings from
the country.
In the first half of 2018, tropical sawn hardwood imports
declined 1% to 118,000 MT in Belgium, 18% to 24,800
MT in the UK, 27% to 16,100 tonnes in Spain, and 27% to
9,600 MT in Portugal.
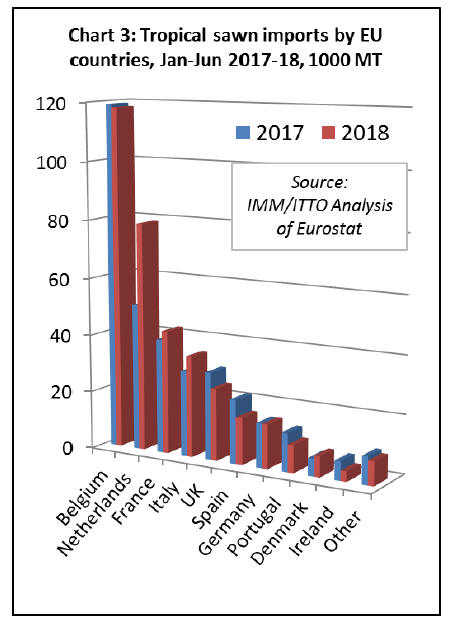
However, these losses were offset by a 56% rise to 78,900
MT in the Netherlands, an 8% rise to 42,600 MT in Italy
and an 18% rise to 34,900 MT in Italy. German imports
were level at 15,100 MT (Chart 3 above).
EU imports of tropical logs recover a little ground
After a downturn in 2017, the quantity of EU imports of
tropical logs recovered a little ground in the first half of
2018. Imports of 53,300 MT during the first half of the
year were 3% greater than the same period in 2017.
However, the value of tropical logs imported by the EU
fell 3% to €27 million.
EU imports of tropical logs decreased from Congo, the
leading supplier, falling 3% to 12,300 MT. There was also
a large fall in EU log imports from Angola, from 3,800
MT in the first half of 2017 to negligible levels in the
same period this year.
However, these losses were offset by rising imports from
CAR (+59% to 10,200 MT), DRC (+19% to 10,100 MT)
and Liberia (+20% to 3300 MT) (Chart 4).

Most of the gain in EU imports of tropical logs in the first
half of 2018 was concentrated in France (+21% to 20,700
MT) and Belgium (+23% to 13,200 MT). Imports of
tropical logs in Portugal fell 25% to 8000 MT during the
period.
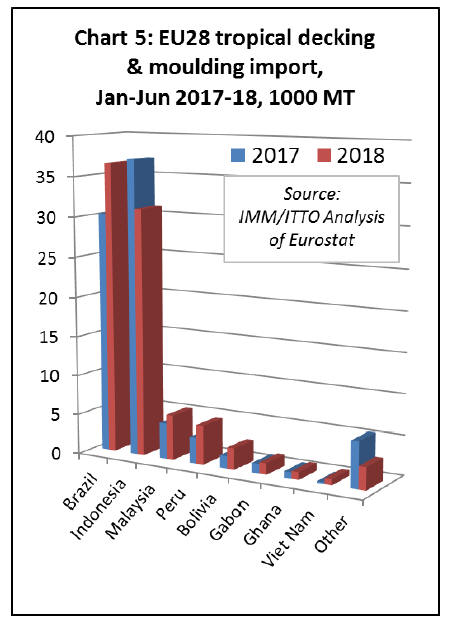
Slight rise in EU tropical decking imports
EU imports of tropical mouldings (which includes both
interior mouldings and exterior decking products)
increased slightly, by 3% to 86,700 MT in the first quarter
of 2018. Import value also increased by 3%, to €127
million.
A 21% rise in EU imports of mouldings from Brazil to
36,600 MT offset a 16% decline in imports from Indonesia
to 31,100 MT.
As noted earlier, the latter decline may be partly due to
alterations in the HS codes used to record imports from
Indonesia since introduction of FLEGT licensing.
EU imports of mouldings increased for some smaller
suppliers of this commodity in the first quarter of 2018
including Malaysia (+26% to 5,600 MT), Peru (+47% to
4,800 MT) and Bolivia (+71% to 2,700 MT) (Chart 5).
In the first half of 2018, imports of tropical decking
increased in France and Belgium but declined in Germany,
the Netherlands and the UK.
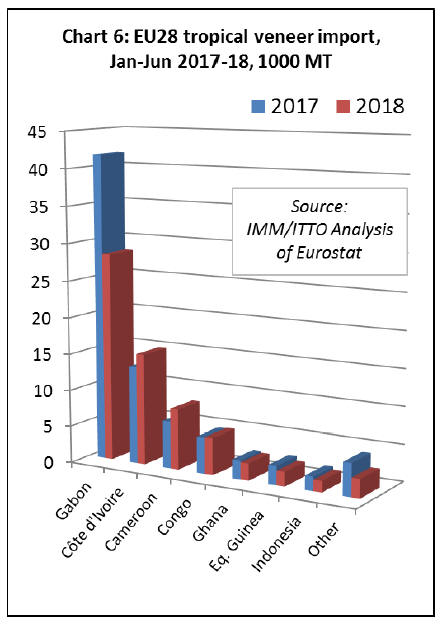
EU imports of tropical veneer down 17%
After a rise in trade in the previous two years, EU imports
of tropical hardwood veneer fell 17% to 65,100 MT in the
first 6 months of 2018. Import value fell by 17% to €84.2
million. The decline was mainly due to a 32% decrease in
imports from Gabon, to 28,300 MT.
This decline is likely related to the financial difficulties
experienced by Rougier this year. The decline in EU
imports from Gabon was partly offset by rising imports
from Cote dˇŻIvoire (+14% to 15,100 MT) and Cameroon
(+29% to 8,200 MT). (Chart 6).
Imports of tropical veneer declined into the two largest EU
markets in the first half of 2018, falling 22% to 22,900 MT
in France and 8% to 15,400 MT in Italy. There was also a
sharp 53% decline in imports in Greece, to 3,600 MT.
Imports to Spain were level at 11,500 MT.
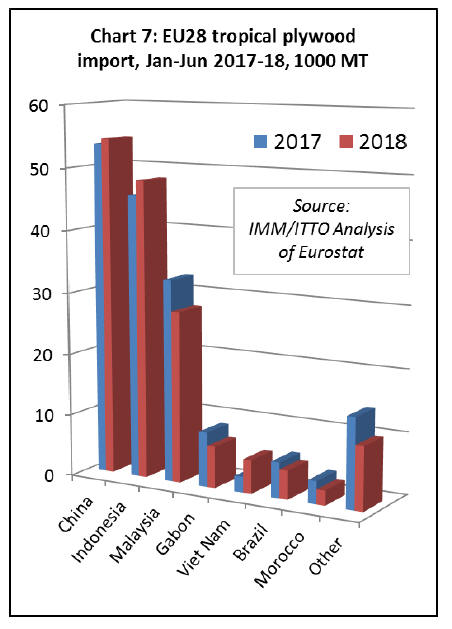
EU direct imports of plywood from the tropics decline
9%
In the first six months of 2018, EU imports of products
faced with tropical hardwood manufactured in China
increased 2% to 54,500 MT. This gain was achieved
despite reports of supply being disrupted by tough new
national environmental controls, which forced Chinese
mills to interrupt production to upgrade or replace
emission and waste treatment technology.
Direct EU imports of plywood from tropical countries
decreased 9% to 160,100 MT in the first half of 2018.
While imports from Indonesia increased 5% to 48,000
MT, imports from Malaysia fell 15% to 27,700 MT and
imports from Gabon fell 23% to 6,700 MT in the first half
of the year.
Although still only a minor supplier, there was a
significant 113% increase in EU imports of plywood from
Vietnam, to 5,400 MT, in the first half of 2018. (Chart 7).
Imports of tropical plywood in the UK were 80,500 MT in
the first half of 2018, the same as last year. A 31% decline
in imports in Belgium, to 20,800 MT, was partially offset
by rising imports in the Netherlands (+12% to 16,600
MT), Germany (+13% to 13,300 MT), and France (+2% to
10,400 MT).
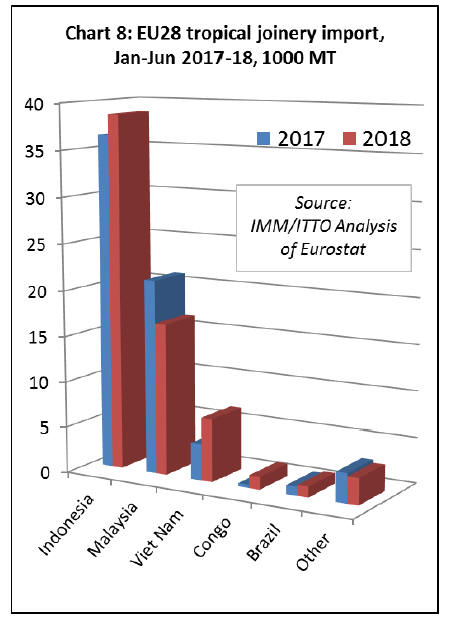
Indonesia boosts share of EU tropical joinery imports
EU imports of tropical joinery products (excluding
flooring) increased 2% to 67600 MT in the first half of
2018. However, import value decreased, by 7% to €126
million, which may imply some shift in the mix of
products involved.
In quantity terms, imports from Indonesia, by far the EUˇŻs
largest tropical supplier of joinery products, which consist
mainly of doors and laminated window scantlings and
kitchen tops, increased 6% to 38,700 MT.
There was also a 72% increase in EU imports of joinery
products from Vietnam, to 6800 MT, during the six-month
period. Imports from Congo increased from negligible
levels to 1400 MT. These gains offset a 22% decline in
imports from Malaysia to 16,600 MT. (Chart 8).
Imports of tropical joinery products in the UK, by far the
largest European destination for this product group,
increased 19% to 31,300 MT in the first six months of
2018. Imports increased by 37% to 9000 MT in Belgium
and by 60% to 7100 MT in France in the same period.
However, imports fell 36% to 12400 MT in the
Netherlands.
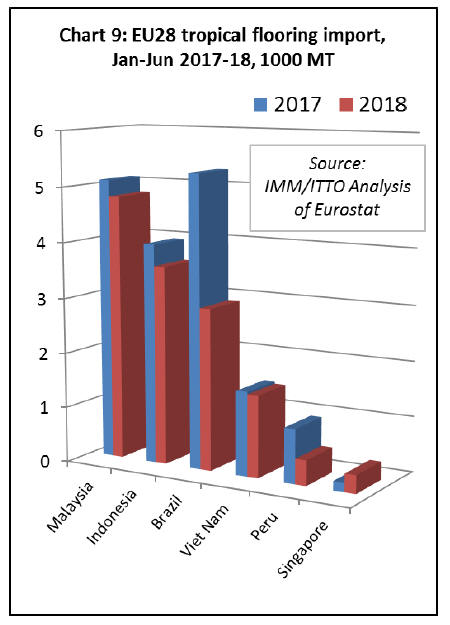
Another fall in EU imports of tropical flooring
EU imports of flooring products from tropical countries
fell a further 21% to, to 14,500 MT in the first half of
2018, continuing a long term decline in response to tough
competition from European and Chinese manufacturers
and non-wood alternatives, fashion trends favouring
temperate timbers, supply contraints, and challenges of
EUTR conformance. The value of EU imports of wood
flooring declined 18% to €32 million in the first half of
2018.
Most of the downturn in the first half of 2018 was due to a
45% fall in imports of hardwood flooring products from
Brazil, to 2900 MT. However imports also fell 6% from
Malaysia, to 4800 MT, 9% from Indonesia to 3,600 MT
and 53% from Peru to only 500 MT. (Chart 9).
In the first half of 2018, imports fell dramatically into the
two largest EU markets for tropical flooring, declining
49% to 3000 MT in France and 18% to 1800 MT in
Belgium.
However, this decline was partially offset by a 82%
increase in imports in Denmark, to 1700 MT, which was
the third largest EU destination for tropical flooring during
the six month period.
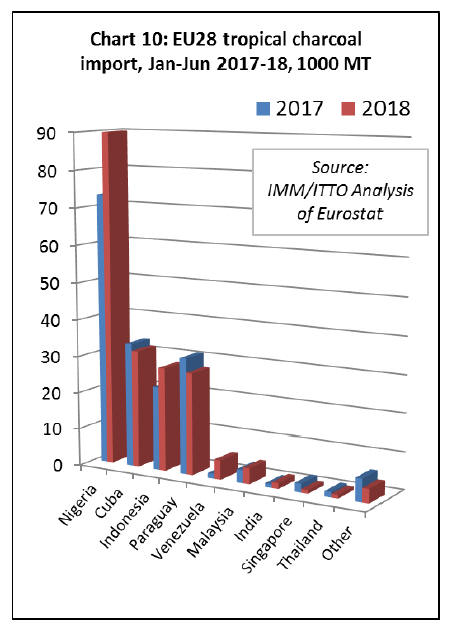
Gradual rise in EU imports of tropical charcoal
EU imports of charcoal from tropical countries has been
gradually rising since the start of 2017. Imports of
194,000 MT in the first six months of 2018 were 10%
more than the same period last year. The value of EU
imports increased 8% to €72.3 million in the same period.
EU imports of charcoal from Nigeria increased 23% to
89,900 MT, while imports from Indonesia were up 24% at
27,900 MT. Imports from Venezuela increased from
negligible levels to 5200 MT. These gains offset a 5%
decline in imports from Cuba to 31,700 MT. (Chart 10).
A wide range of EU countries now import wood charcoal
from tropical countries, the largest destinations (in
descending order this year) being Poland, Germany,
Greece, Belgium, Italy, UK, Portugal, and Spain.
In the first six months of this year, imports increased in
Poland (+31% to 35300 MT), Greece (+14% to 25,500
MT), Belgium (+43% to 23200 MT), Italy (+43% to
17500), and Portugal (+24% to 13000 MT). However
imports declined 17% to 31,500 MT in Germany, 4% to
14,600 MT in the UK, and 15% to 12600 MT in Spain.
|