|
Report from
North America
Plywood imports fall across the board in June
Hardwood plywood imports fell by almost one third in
June to 209,842 cu.m. but year-to-date imports were 22%
higher than in June 2016. The value of plywood imported
in June declined 15% month-over-month to US$139
million.
The largest drop was in imports from China. ChinaˇŻs
plywood shipments to the US fell by almost half to 84,913
cu.m. in June. The value of Chinese plywood imports was
down one third from May.
The US introduced preliminary antidumping duties on
Chinese hardwood plywood in June. Cash deposits based
on the preliminary duties of 57.36% to 114.72% are now
required for hardwood plywood from China. Only Linyi
Chengen Import and Export Co. Ltd. was assessed at a rate
of zero.
Hardwood plywood imports from most other countries
also declined in June, a sign that the new antidumping
duties are not the only reason for the overall decrease in
US plywood imports.
Malaysia was an exception and almost doubled the value
of shipments to the US market in June. The US imported
10,323 cu.m. of hardwood plywood from Malaysia in June
almost doubled compared to June 2016.
Veneer imports up from Côte dˇŻIvoire and India
Tropical veneer imports grew in June to US$2.6 million,
but the year-to-date value of imports is only half of what
the US imported in June 2016.
Italy was again the largest source of tropical veneer in
June, but veneer imports from Côte dˇŻIvoire increased
56% in June to US$465,475. Imports from India were also
up at US$307,871. Veneer imports from China, Ghana and
Cameroon declined in June.
Brazil loses market share to China in hardwood
mouldings market
The US imported US$15.0 million worth of hardwood
moulding in June, down 15% from May. Year-to-date
imports were slightly higher (+1%) than in June 2016.
Imports from most countries declined in June with the
large drop in imports from Brazil. BrazilˇŻs shipments fell
one third to US$2.4 million. Imports from Malaysia fell to
just over US$0.5 million in June.
Imports from China accounted for over 40% of total
hardwood moulding imports in June. Chinese moulding
imports were worth US$6.2 million, up 27% year-to-date
from June last year.
Hardwood flooring imports significantly up from 2016
Hardwood flooring and assembled flooring panel imports
increased in June to US$5.4 million and US$13.3 million,
respectively. Year-to-date hardwood floor imports grew
23% compared to the same time last year.
Year-to-date imports of assembled flooring panels
(engineered wood flooring) was only slightly higher than
in June 2016.
Hardwood flooring imports from Malaysia more than
doubled from May to US$413,458, but year-to-date
imports are still less than half compared to June last year.
Indonesian shipments increased to US$766,634 in June,
but the largest month-over-month growth was in imports
from China. Hardwood flooring from China was worth
US$1.9 million in June.
In assembled flooring panels, both China and Indonesia
exported less to the US than in May. Canada was the
largest import source of assembled flooring in June, but in
year-to-date imports China is still slightly ahead of
Canada. Assembled flooring imports from Thailand
increased significantly in June (US$692,010).
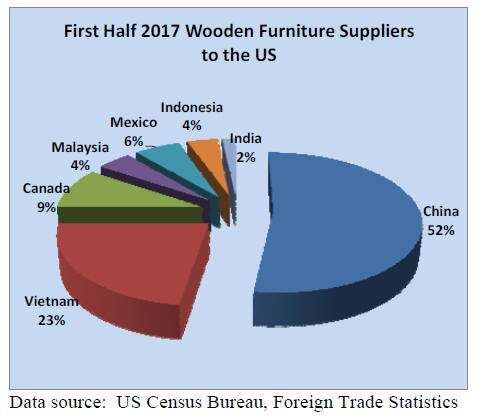
China expands dominance of wooden furniture
imports
Wooden furniture imports declined slightly in June to
US$1.61 billion, but year-to-date imports remain well
above June 2016 levels (+10%). Year-to-date imports
from all major supplier countries were up in the first half
of 2017, compared to the same time in 2016.
Furniture imports from China, Mexico and Europe grew in
June, while imports from Vietnam, Canada, Malaysia,
Indonesia and India were down from the previous month.
China increased its share in US wooden furniture imports
in June accounting for over 50% of imports of the top
seven shippers.
Imports from Europe were worth US$143 million in June,
up 6% from May. More recently the euro-dollar exchange
rate has become less favourable to European exporters,
which is likely to dampen the growth in European
furniture exports to the US.
Non-upholstered seating furniture and office furniture
imports dropped the most in June (14% and 13%,
respectively). Kitchen furniture imports increased by 3%
in June while imports of upholstered seating were
unchanged from May.
Higher US furniture orders despite weak retail
The latest survey data on US residential furniture
manufacturers and distributors was surprisingly positive,
despite lower retail sales reported by the US Census
Bureau.
New furniture orders increased 8% in May from the same
time last year, according to the Smith Leonhard industry
survey of residential furniture manufacturers and
distributors. New orders were 7% higher than in April.
Over half (58%) of all survey participants reported order
gains, up from 47% in April.
Furniture shipments increased 7% from May 2016 and
12% from April this year. Inventory levels at distributors
and manufacturers were slightly up from April but
consistent with business conditions.
Retail sales at furniture stores were declined 1.9% in June
from the previous month. June sales were unchanged from
June 2016, according to the US Census Bureau.
Furniture retail appears a bit weak when considering the
high consumer confidence in the economy, low
unemployment and an overall strong housing market.
Many other retail sectors grew even less than furniture
retail. Total US retail and food services decreased 2.7% in
June from the previous month.
GDP growth up in second quarter
GDP growth accelerated in the second quarter of 2017.
GDP grew at an annual rate of 2.6% in the second quarter
of 2017, according to the advance estimate by the Bureau
of Economic Analysis. In the first quarter, real GDP
increased 1.2%. Higher personal consumption and nonresidential
construction contributed to the higher GDP in
the second quarter.
The unemployment rate has changed little in recent
months and was 4.3% in July.
Consumer confidence rose in August to its highest level
since January 2017, according to the University of
MichiganˇŻs survey of consumers. Consumers have a more
positive outlook for the overall economy and for their
personal financial circumstances. The University of
MichiganˇŻs estimate for personal consumption growth in
2017 remained at 2.4%.
Housing market steady despite lower July starts
Housing starts decreased 4.8% in July to a seasonally
adjusted annual rate of 1,155,000, according to the US
Department of Housing and Urban Development and the
Commerce Department. July starts were 5.6% lower than
in July 2016.
The largest decline was in the more volatile multi-family
construction sector, while single-family starts were nearly
unchanged from June. Multi-family construction was at its
highest in 2015 and has since declined as more Americans
are looking to purchase single-family houses.
The number of building permits issues for single-family
homes, which indicates future building activity, were
unchanged from June at a seasonally adjusted annual rate.
The size of new single-family homes has decreased during
the second quarter of 2017, according to US Census
Bureau data. This is a good sign for the housing market,
according to the National Home Builders Association.
Directly after the recession home sizes rose because highend
wealthy buyers returned to buying homes sooner. A
decline in home sizes indicates that more households
including first-time buyers are now investing in housing.
BuildersˇŻ confidence in the market for new single-family
homes gained in August, according to the National
Association of Home Builders/Wells Fargo Housing
Market Index. The cost of building lots, labour and
building materials remain a concern.
Total sawn softwood imports and imports from Canada
have declined since the US imposed preliminary
countervailing duties on most Canadian softwood in April.
The US has increased softwood imports from Europe,
while purchasing from Brazil has remained steady and
imports from Chile have even declined in the first half of
2017.
|