Japan
Wood Products Prices
Dollar Exchange Rates of 10th
June 2017
Japan Yen 110.33
Reports From Japan
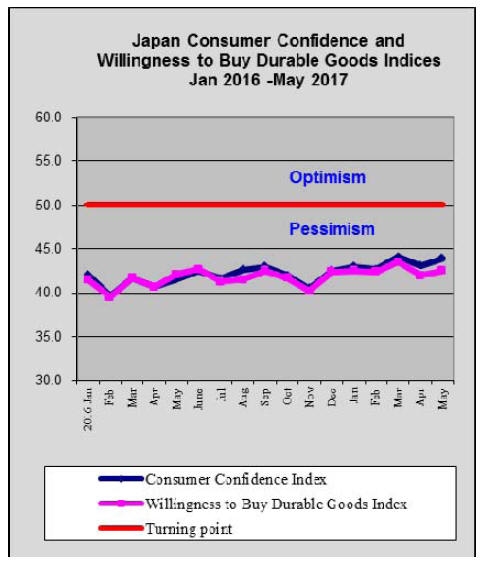
Consumer confidence indices edge higher but
not the
index on spending
May consumer confidence and perception indices have
been released by the Cabinet Office in Japan. The overall
Consumer Confidence Index for May 2017 rose slightly
month on month but is still below the threshold for
optimism.
The data from the Cabinet Office includes consumer
perceptions and the May survey revealed that in terms of
prospects for overall livelihood, income growth and
employments edged higher but the willingness to buy
durable goods (which includes items such as furniture)
remained flat.
See: http://www.esri.cao.go.jp/en/stat/shouhi/shouhi-e.html
Low unemployment but still consumer spending will
not budge
May heralded the start of the annual recruitment drive by
most companies in Japan. The target is university students
who will graduate in early 2018.
Recent Ministry of Labour data showed the ratio of job
openings to job seekers is now more extreme than the high
seen during the Japanese ˇ®bubble economyˇŻ in 1990. The
ratio of job openings to job seekers in April this year rose
to the highest level in more than 40 years.
Unemployment in Japan is at its lowest level for around 20
years but this is not all good news. Analysts are warning
this is mostly due to a shrinking labour force and that high
employment, coupled with low productivity (a serious
issue in Japanese companies) is not good for consumers as
higher than necessary costs are passed on through sales
prices.
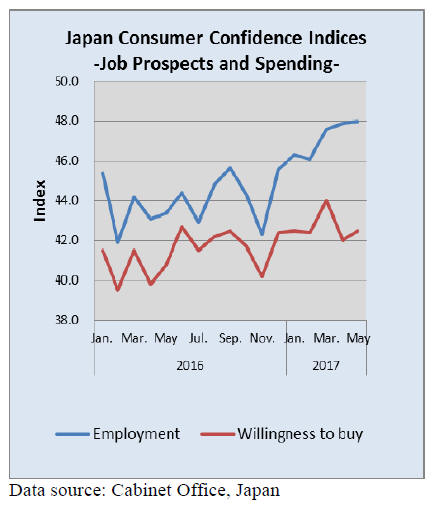
The major challenge in Japan is to stimulate consumer
spending which refuses to budge. An analysis of the latest
consumer confidence data is revealing.
In a situation where consumer perceptions of job prospects
and employment have been rising steadily this should have
translated into consumers having confidence to spend but
this is not happening as can be seen in the following
graphic.
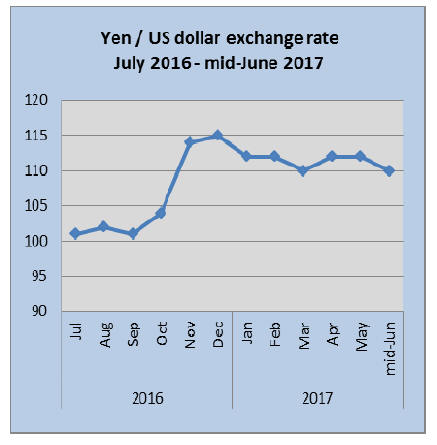
US rate hike already factored into Yen exchange
rate
Better than expected US employment data resulted in a
stronger US dollar in mid June and in Japan an
improvement in industrial output and investment has
brought relief to the government and Bank of Japan.
Despite the improvement in some main economic
indicators, political issues in the US are still swirling and
creating heightened risks for the Japanese economy.
Import round-up
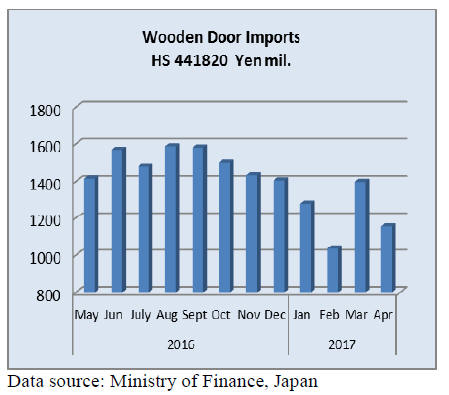
Doors
JapanˇŻs April wooden door (HS 441820) imports dropped
17% compared to a month earlier and were down around
8% year on year. The volatility in monthly door imports is
unusual and cannot be explained by either currency
fluctuations or housing start trends.
At 58% of all wooden door imports in April, China was
the main supplier followed by the Philippines (15%),
Malaysia (12%) and Indonesia (8%).
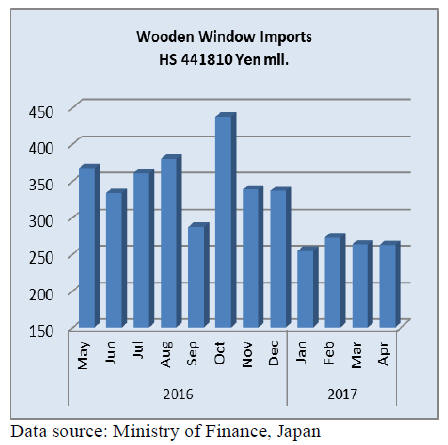
Windows
Wooden window (HS441810) imports into Japan for the
first four months of this year are down around 17%
compared to the same period last year. For every month
this year imports of wooden windows have been well
below that of a year ago.
Over 75% of JapanˇŻs wooden window imports come from
China and the US and most of the balance is made up of
shipments from the Philippines.
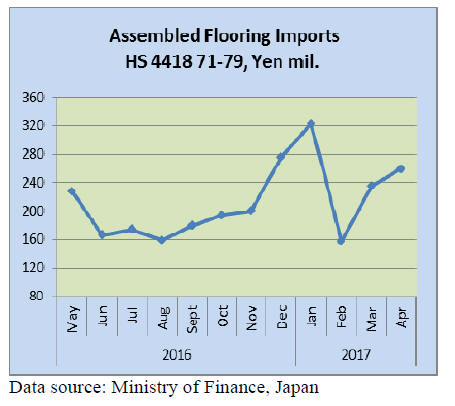
Assembled flooring
After the unexpected decline in assembled flooring
imports recorded in February this year, there was a
rebound in March and this continued into April.
JapanˇŻs April imports of assembled flooring (HS441871-
79) were 10% up on levels in March and were almost 50%
higher than in April 2016.
Most of JapanˇŻs imports of wooden flooring fall within HS
441875 (65%) and HS441879 (29%). Shippers in China
dominate supplies of HS 441875 but for HS441879
supplies come from China, Thailand and Indonesia.
Because of the unusually high level of imports in
January
this year, there has been an almost 30% increase in arrivals
of wooden floor imports during the first four months of
this year.
Plywood
The figure below shows the trend in imports of plywood (
HS 441210/31/32/33/34 and 39).
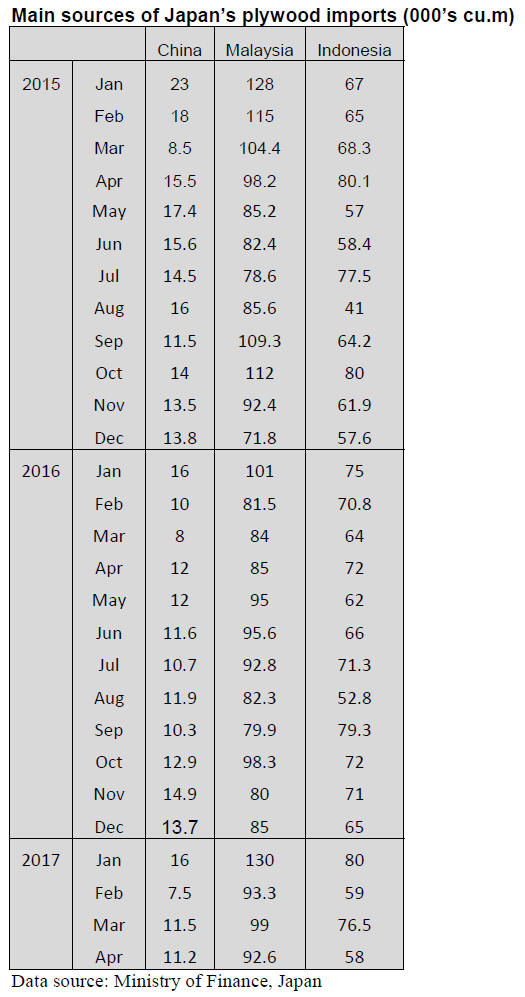
Three shippers, Malaysia, Indonesia and China continue to
dominate the Japanese market for imported plywood.
Shipments of plywood within HS 441231 account for the
bulk of JapanˇŻs plywood imports and in April this year
amounted to some 86% of all plywood imports. HS441233
and 34 account for another approx. 12% of imports.
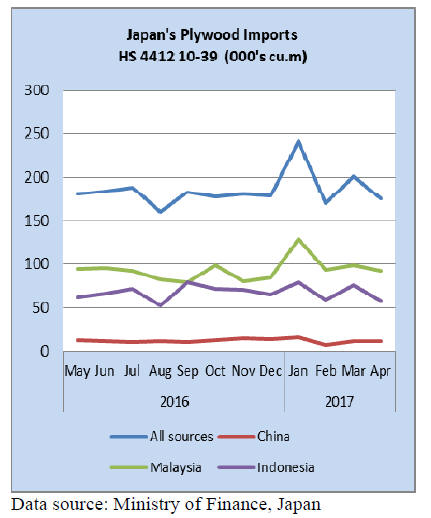
In April this year shippers in China supplied around
the
same volume to Japan as was the case in March (approx.
11,000 cubic metres) on the other hand shipments from
both Malaysia and Indonesia were down compared to a
month earlier.
Shipments from Malaysia were down 6.5% in April
while
shipments from Indonesia were down almost 25% from
March.
However, for the first four months of this year shipments
to Japan from Malaysia were up around 18%. On the other
hand shipments from Indonesia in the first four months of
this year were up slightly compared to the same period in
2016.
ˇˇ
Trade news from the Japan Lumber Reports (JLR)
For the JLR report please see:
http://www.nmokuzai.
com/modules/general/index.php?id=7
Clean Wood law promulgated
The Clean Wood law to promote using legally proven
wood products is promulgated on May 1. It is effective
since May 20. This is also titled as the law to promote of
using and distribution of legally harvested wood products.
Purpose of the law is to increase using wood products
proven legally at private industry level.
There are two categories. One is primary handling
industry, which receive logs directly from log harvesters
such as initial processors of sawmill, plywood mill,
exporter or importer from overseas suppliers.
Secondary group is wood industry except for the primary
group, which deals with processing, marketing and
construction.
Objects are all products using wood mainly such as desk,
chair, cabinet, shelf, paper products flooring, siding board
and biomass for power generation.
Regarding registration, application requires type of
category, primary or secondary, type of business such as
wood processor, wood marketer, exporter or importer,
builder, biomass power generator then section to secure
use of legally certified wood products. Volume of wood
use is for one year.
Primary dealers need to register species of wood and
country of origin and region where wood is harvested.
Also what measures are taken to handle legally proven
wood products and who is in charge needs to be registered.
Registration organizations publicize contents of individual
registration by internet. Registered dealers need to report
to the Minister in charge status of handling of legally
proven wood once a year and the
officials can make investigation of office, warehouse and
plant. There is penalty for false report.
Actually registration organizations have not been assigned
yet so that actual registration will be next fall when the
law is actually put into practice. Therefore,
acknowledgment in the industry for the law is low yet.
Once large house builders register, materials suppliers
need to follow the law to procure legally proven or forest
certified wood but such move has not started yet.
Review of 2016 domestic wood demand
Demand for domestic wood in 2016 was 20,629,000 cbms,
3% more than 2015. The demand increased because new
housing starts increased in 2016. In particular, log demand
for plywood was very active with 3,682,000 cbms, 9.7%
more than 2015.
Logs for lumber were 12,180,000 cbms, only 1.5% more.
Logs for wood chip were 4,791,000 cbms, 2.3% more.
Total demand including imported logs was 26,029,000
cbms, 3.7% more. Imported logs were 5,370,000 cbms,
6.4% more in which North American logs were 4,106,000
cbms, 8% more.
In total log demand, share of domestic wood was
79.4%,
0.5 points less than 2015.
Regardless of effort to develop new demand for domestic
wood, last yearˇŻs result revealed new housing starts are the
key factor for domestic wood. Except structural materials,
log demand for plywood has largely increased. To expand
demand for housing, new materials are necessary like
strong earthquake resistance or large wooden buildings
like CLT.
According to wood demand statistics of 2015, total wood
demand was 75,160,000 cbms in log scale, 0.8% down
from 2014 but domestic production was 24,918,000 cbms,
5.4% up so share of domestic wood was 33.2%.
Domestic production of industrial wood was 21,580,000
cbms, 1.5% more while logging residue left in the woods
was 217,000 cbms, 6.1% down. Logs for fuel largely
increased with 3,962,000 cbms, 34.8% up because more
biomass power generation plants started operation.
Log export declined in 2016 with about 640,000 cbms
after Chinese economy got shaky and the yen weakened.
This business is largely relied on exchange rate.
As to imported wood, total declined including logs except
for wood chip of 21,023,000 cbms, 2.1% up and for fuel of
1,156,000 cbms, 5.3% up. This trend continues but in
2016, total recovered because of active housing starts in
Japan.
Log production by the regions is over 5 million cbms by
six prefectures in the North East region and nearly 6
million cbms by seven prefectures in Kyushu.
By species, cedar was 11,848,000 cbms, 5.5% up. Cypress
was 2,466,000 cbms, 4.1% more. Larch was 2,312,000
cbms, 0.6% more and fir was 1,013,000 cbms, 4.5% more.
Hardwood species were 2,188,000 cbms, 2.1% less.
Demand for hardwood was down for paper and pulp
manufacturing but the demand as fuel for biomass power
generation is expected to increase.
While demand for domestic wood is increasing, challenge
is how to maintain sustained yield management of the
forest by effective reforestation.
Total wood supply in 2016 by use is 12,182,000 cbms for
lumber, 1.5% more, 3,682,000 cbms for plywood, 9.7%
more and 4,796,000 cbms for wood chip, 2.3% more.
Total was 20,660,000 cbms, 3.0% more. Increase for
lumber is largely due to increase of ownerˇŻs units and
units built for sale in housing starts in 2016.
Actually in 2016, supply of both domestic and imported
logs increased so the increase is simply by more housing
starts and there was no remarkable shift from imported
woods to domestic wood.
Imported log supply was 5,370,000 cbms, 6.4% more in
which 4,408,000 cbms, 5.5% more was for lumber and
957,000 cbms, 10.8% more for plywood so increase of
imported logs was more than domestic logs.
As a result, share of domestic logs was 79.4%, 0.5 points
less in which logs for lumber was 73.4%, 0.8 points less
and for plywood was 79.4%, 0.2 points less.
Number of sawmills continues declining with 4,933, 272
less than 2015. Log consumption by mill was 3,356 cbms,
8.4% more because size of mill is getting larger. 69.5% of
log consumption is by large mills with electric power
output of more than 300 kw so share of large mills is
increasing.
Logs consumed by sawmills 12,182,000 cbms by species,
cedar was 8,095,000 cbms, 2.9% more than 2015 and
cypress was 1,983,000 cbms, 2.5% more. Larch was
1,150,000 cbms, 4.0% less. Pine was 128,000 cbms,
16.9% less. The decline is due to less demand by plywood
mills.
Logs for plywood were 4,638,000 cbms, 10.0% more, out
of which domestic logs were 3,628,000 cbms, 9.7% more
and imported logs were 957,000 cbms, 10.8% more but
the share of domestic and imports remains unchanged.
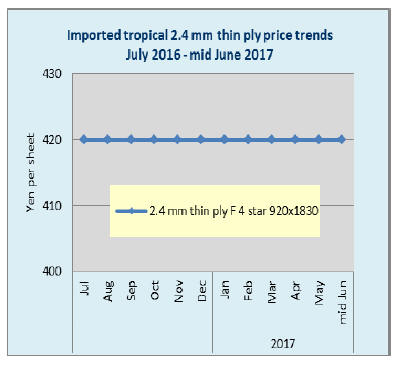
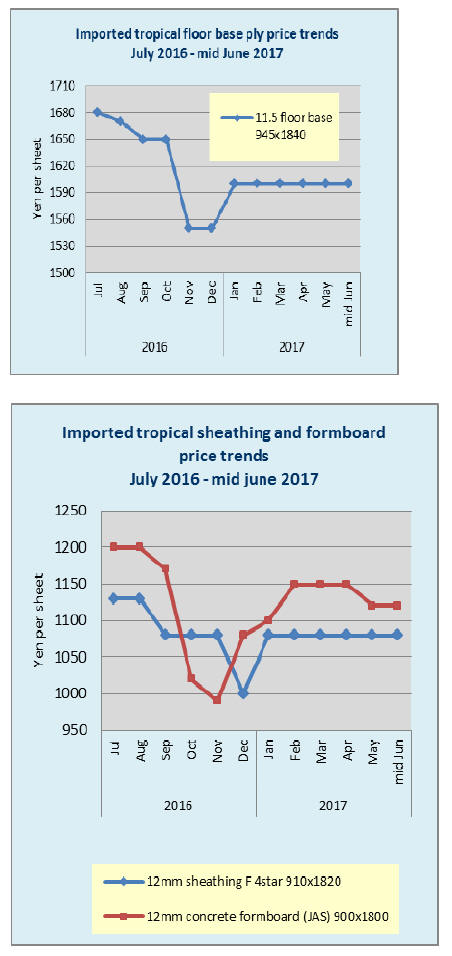
Mid-June wholesale plywood prices
As yet there is no sign of the higher plywood prices being
sought by shippers in Malaysia affecting wholesale prices
in Japan.
|