|
Report from
North America
US imports of tropical sawnwood rise further in 2015
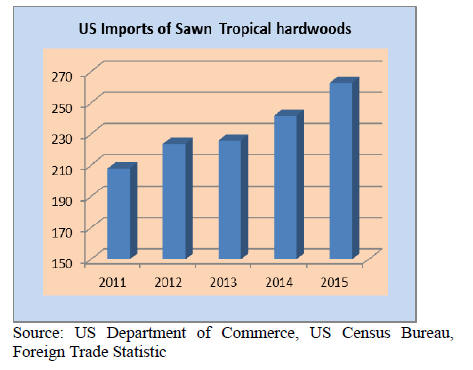
The volume of sawn tropical hardwood imports increased
9% in 2015 to 263,022 cu.m. valued at US$289.9 million.
The share of tropical sawnwood in total US hardwood
imports was 23% in 2015, unchanged from the previous
year.
In 2013 the tropical share was 27%, but the volume of
tropical imports was lower than in 2015.
Imports of most species grew in 2015 with the exception
of balsa, virola and cedro. Balsa remained the most
significant imported species at 53,290 cu.m. but the
volume was 6% below 2014.
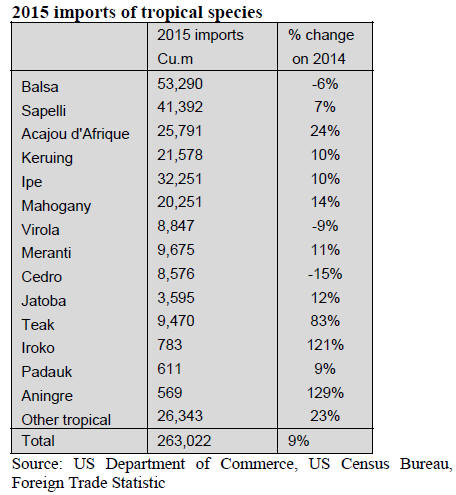
Imports of sapelli sawnwood grew 7% in 2015 to 41,392
cu.m., following a 23% increase in 2014. In third place
was ipe at 32,251 cu.m., up 10% from 2014.
Imports of acajou dĪ»Afrique sawnwood declined in 2014,
but in 2015 imports increased 24% to 25,791 cu.m.
Imports of keruing were 21,578 cu.m. in 2015, up 10%
from 2014. Mahogany imports grew 14% to 20,251 cu.m.
Amongst the fastest rates of increase in 2015 imports
iroko, aningre and teak sawnwood stand out. Teak imports
grew 83% to 9,470 cu.m. Much of the growth was in teak
imports from India which supplied 4,614 cu.m. to the US.
Imports from Africa grew faster in 2015 than shipments
from Latin America and Asia. Imports from Cameroon
and Congo (Brazzaville) increased significantly in 2015,
but Ghana and Cote dĪ»Ivoire shipped less than in 2014.
Ecuador and Brazil remained the largest suppliers to the
US market, despite lower balsa imports.
Imports from Brazil were 42,167 cu.m. in 2015, up 8%.
Sawnwood imports from Malaysia and Indonesia
increased by 9% and 15%, respectively, from 2014 due to
higher shipments of keruing and meranti.
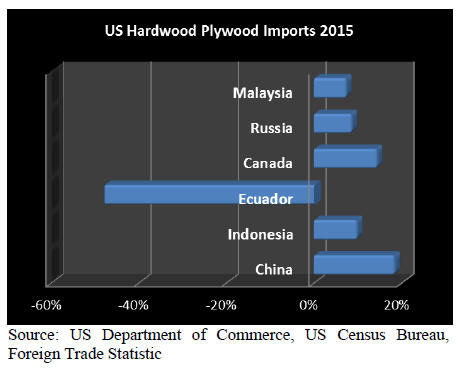
China increases hardwood plywood market share in
2015
US imports of hardwood plywood increased 12% in 2015
compared to the previous year. A total of 3.25 million
cu.m. of hardwood plywood were imported in 2015. The
antidumping duties on Chinese plywood were removed in
November 2013, but imports did not recover until 2015.
China exported 1.80 million cu.m. of plywood to the US in
2015. Its share in total US plywood imports grew from
52% in 2014 to 55% in 2015.
All other major sources of hardwood plywood increased
shipments to the US in 2015, with the exception of
Ecuador. Imports from Ecuador fell by almost half to
88,342 cu.m.
Indonesia remained the second-largest source of imports in
2015 at 491,965 cu.m., up 10% from the previous year.
Imports from Malaysia grew 7% from 2014 to 78,627
cu.m.
Imports of hardwood plywood from countries other than
Malaysia and Indonesia increased by 21% in 2015. Of the
others, Europe was the most significant supplier led by
Spain, Italy and Latvia (with Latvia producing mainly
birch plywood).
The US imported 38,908 cu.m. of plywood from Uruguay
in 2015, 25,400 cu.m. from Panama, and 25,017 cu.m.
from Brazil.
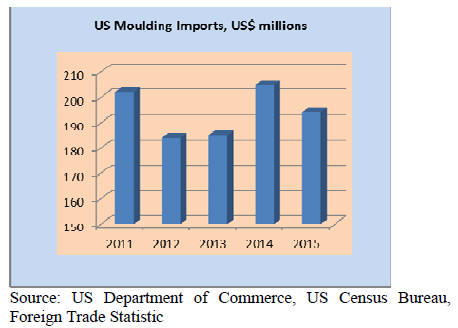
Decline in hardwood moulding imports
The value of hardwood moulding imports into the US
declined 5% in 2015 from the previous year, despite the
growth in home construction. Hardwood moulding imports
were worth US$194.2 million, down from US$204.6
million in 2014.
Imports from all major suppliers decreased. China
remained the largest source of imports at US$65.3 million.
Imports from Brazil were worth US$48.4 million, down
9% from 2014. Imports from Malaysia declined 10% to
US$13.4 million.
30% growth in hardwood flooring imports in 2015
US imports of wood flooring increased again in 2015,
following a year of significant growth in 2014.
Hardwood flooring imports were worth US$47.4 million
in 2015, up 30% from 2014. Imports from all countries
increased, but the strongest growth was in Canadian
shipments where manufacturers benefited from the weak
Canadian dollar.
Indonesia and Malaysia were the largest sources of
imports at US$10.7 million and US$10.1 million,
respectively. Hardwood flooring imports from Indonesia
grew by over half from 2014. Imports from China were
worth US$8.7 million, up 19% from the previous year.
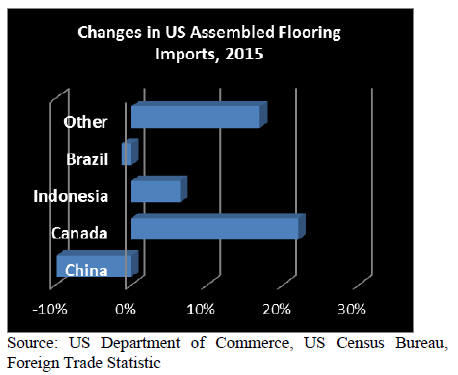
Imports of assembled wood flooring panels were worth
US$136.5 million, up 3% from 2014. The strongest
growth was in imports from Canada, while assembled
wood flooring imports from China fell 10% in 2015 to
US$60.7 million. Indonesia exported US$8.1 million
worth of assembled flooring panels to the US in 2015, up
6% from the previous year.
Strong increase in wooden furniture imports from
Malaysia and Vietnam
US furniture imports grew faster in 2015 than in the two
previous years. Wooden furniture imports were worth
US$16.23 billion in 2015. Imports from all major
suppliers increased.
ChinaĪ»s share in total imports decreased slightly to 47.3%,
while VietnamĪ»s share grew to 18.5%. MalaysiaĪ»s share in
total imports increased from 3.8% in 2014 to 4.1% last
year.
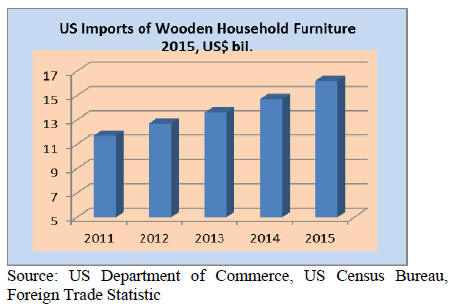
The strongest growth was in imports from Malaysia and
Vietnam. Imports from Malaysia were worth US$673.3
million in 2015 (+20%). Vietnam exported close to US$3
billion worth of wooden furniture (+19%). Imports from
China increased 10% to US$7.67 billion in 2015.
Furniture imports from Mexico have grown in recent
years. In 2015, the US imported US$760.3 of wooden
furniture from Mexico, representing almost 5% of total
imports.
Imports from Indonesia were worth US$587.6 million, up
5% from 2014.
Wooden furniture imports from Europe did not grow as
strongly in 2015 as imports from Asia, Canada and
Mexico.
GDP growth 0.7% in final quarter of 2015
Real GDP grew just 0.7% in the fourth quarter of 2015,
according to the first estimate released by the Bureau of
Economic Analysis. In the third quarter, GDP increased
2.0%.
Stronger residential construction and consumer
consumption made positive contributions towards the
GDP, but investment in non-residential construction
declined in the fourth quarter.
Unemployment was almost unchanged in January 2016 at
4.9%. The Federal Reserve raised target interest rates by a
quarter point in December, but may leave the rate
unchanged in March because of global economic risks and
the slowdown in the Chinese economy.
Wood product and furniture manufacturing activity
improves
Economic activity in the manufacturing sector contracted
in January for the fourth consecutive month despite overall
growth in the economy, according to the Institute for
Supply Management. Based on the Institutes survey,
imports have grown while US exports slowed.
However, the wood products sector and furniture
manufacturing reported growth in January. Wood products
was the industry with the second-highest growth last
month.
2015 housing starts up 11%
An estimated 1,111,200 housing units were started in
2015. This is 11% above the 2014 figure of just over 1
million units.
Single-family housing starts declined in December to
768,000, while the multi-family market remained strong.
The number of building permits were at a seasonally
adjusted rate of 1.232 million in December, down 4%
from the previous month. Permits for single-family homes
increased, but multi-family construction permits declined
in December.
Share of first time home buyers increasing
Sales of existing homes increased across the country in
December. Total sales grew 15% at a seasonally adjusted
annual rate. Transactions that were delayed in November
contributed to the higher sales in December, according to
the National Association of Realtors. Buyers also were
motivated by the prospect of higher mortgage rates in the
New Year.
A positive sign was the higher share of first time buyers in
December. Their share increased from 30% in November
to 32% in December. On average in 2015 30% of all sales
were by first time buyers, lower than any other time in
almost 30 years.
The National Association of Realtors expects more first
time buyers in 2016 because of the positive employment
figures.
Office and commercial construction activity rebounds
Spending in non-residential construction was unchanged
in December from the previous month at a seasonally
adjusted rate, but overall levels remain below expenditures
during the summer according to US Census Bureau data.
Private office and commercial construction was a notable
exception. Both building categories had higher spending
levels in fall and winter than earlier in 2015.
The American Institute of Architects reported a softening
of business conditions in the commercial and industrial
towards the end of 2015. Conditions were stronger in the
South and West than in the Northeast.
Canadian housing construction slipping
Canadian housing starts fell 18% in December at a
seasonally adjusted annual rate. The decrease was in
multi-family construction in the major cities, while singlefamily
construction was unchanged from November.
Overall the housing market remained strong in 2015
despite low oil prices and a contraction in GDP in two
quarters. Low mortgage rates and relatively low
unemployment supported the housing market, except in
Alberta where job losses related to the oil industry were
high.
The Canadian Housing and Mortgage Corporation expect
a modest decline in home construction in 2016 and 2017,
but given the uncertainty in the global economic outlook
housing starts could also strengthen from 2015.
|