US Dollar Exchange Rates of
26th
May 2014
China Yuan 6.2395
Report from China
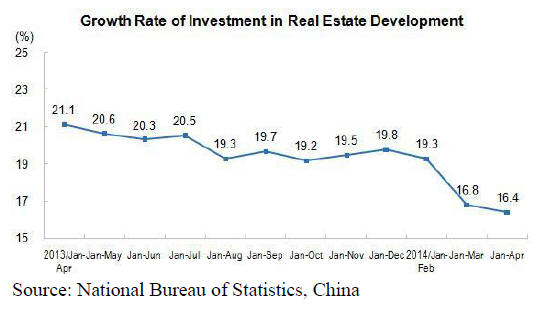
Falling investment in real estate
Total investment in real estate development in the first
four months of 2014 increased 16.4 percent year-on-year
but the pace of investment has been falling since the
beginning of the year.
Of total investment, that in residential buildings was up by
16.6 percent year on year and accounted for 68.5 percent
of all real estate investment.
In the first four months of this year real estate investment
in the eastern region stood at yuan 1,323.0 billion, up by
17.7 percent year-on-year; growth in the central region
stood at yuan 426.8 billion, up by 12.2 percent while in the
western region investment totalled yuan 482.3 billion, up
by 16.6 percent.
Between January and April this year the land area
purchased by real estate development enterprises totalled
81.30 million square metres, a year-on-year decline of 7.9
percent.

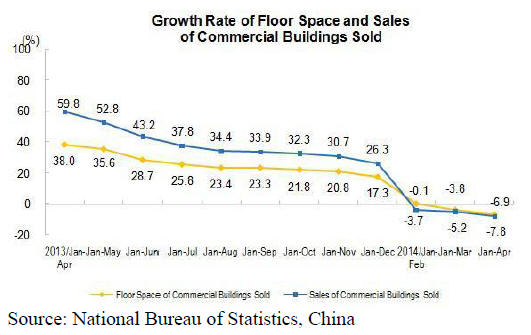
Slower sales of commercial buildings
In the first four months of this year sales of commercial
buildings, in terms of floor space, fell almost 7 percent a
year-on-year and sales of commercial buildings (yuan
1,830.7 billion) fell 7.8 percent.
For more see:
http://www.stats.gov.cn/english/PressRelease/201405/t201
40513_552613.html
April prices for residential buildings in medium and
large cities
The National Bureau of Statistics in China has issued a
press release on the prices of newly built residential
buildings (excluding affordable housing).
See:
http://www.stats.gov.cn/english/PressRelease/201405/t201
40519_555182.html
Amongst some 70 cities surveyed prices of newly
constructed residential buildings fell in 8 cities, prices
were unchanged in 18 cities and increased in the other
cities. The highest month-on-month increase was 0.4
percent while the lowest was minus 0.7 percent.
Prices for second-hand residential buildings declined in 22
cities, were unchanged in 13 cities and increased in 35
cities surveyed.
The press release also provides Price Indices of Newly
Constructed Residential Buildings for the 70 cities
included in the survey.
Compared with the same month last year prices of secondhand
residential buildings fell in 2 cities, remained at the
same level in one city and increased in 67 cities.
Private investment in fixed assets
In the first four months of this year private investment in
fixed assets grew 20.4 percent year-on-year but has been
falling since the beginning of the year.
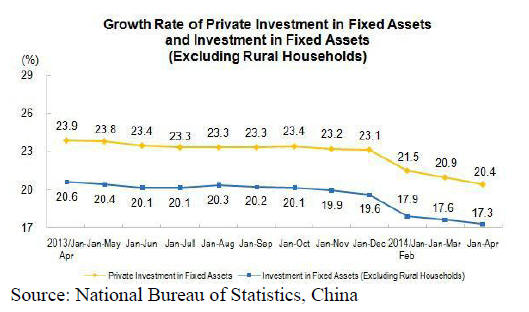
In term of sectors, investment in fixed assets in the
primary industries fell 24.5 percent year-on-year. Fixed
asset investment in secondary industries was down 18.6
percent year-on-year and that in the tertiary industries fell
22.0 percent.
For more see:
http://www.stats.gov.cn/english/PressRelease/201405/t201
40513_552608.html
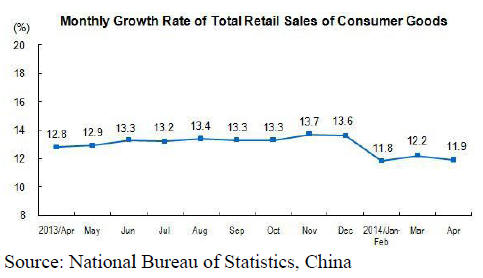
April consumer goods retail sales improve
In April retail sales of consumer goods grew 11.9 percent
year-on-year.
From January to April retail sales of consumer goods was
up by 12.0 percent year-on-year, largely unchanged from a
month earlier. There was a stronger growth of retail sales
in the rural areas but sales in the rural areas account for
only about 15 percent of all retail sales.
For more see:
http://www.stats.gov.cn/english/PressRelease/201405/t201
40513_552615.html
Analysis of China’s imported softwood timber
China‟s domestic timber production rose 2% to 83.67
million cubic metres in 2013. Timber imports (logs and
sawnwood) rose 18% to 79.16 million cubic metres log
equivalent and the value of China‟s timber imports grew
26% to US$16.1 billion in 2013.
In terms of volume the proportion of domestic to imported
timber in 2013 was 51:49 which is roughly similar to that
in 2012.
Domestic timber is mainly used for fibreboard, mine
timber and private purposes in rural areas while imported
timber is mainly used for construction, home interior
decoration and improvements and furniture production.
Softwoods dominate China‟s timber imports and have
increased rapidly in recent years. China‟s softwood timber
imports were 57.18 million cubic metres in 2013 and have
been growing at almost 20% per year since 2008.
Softwood log imports
Softwood log imports in 2013 amounted to 33.16 million
cubic metres valued at US$5.114 billion, up 24% in
volume and 37% in value over 2012.
China‟s imports of softwood logs are mainly from Russia,
New Zealand, the US, Canada, Australia, Ukraine and
European countries.
The combined imports from these countries accounted for
over 90% of all softwood log imports in 2013.
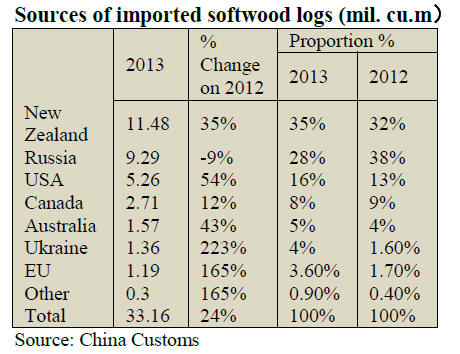
China‟s softwood log imports in 2013 from the listed
countries increased except for Russia where imports fell
9% to 9.29 million cubic metres yea- on-year.
China‟s softwood log imports from New Zealand, the
largest supplier in 2013, increased by nearly 3 million
cubic metres to 11.48 million cubic metres. In 2013, for
the first time, imports from New Zealand exceeded those
from Russia.
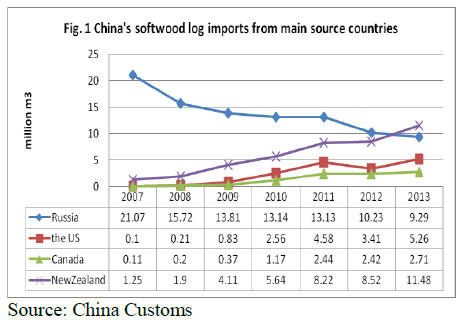
It will be seen from the figure below that there has been a
steady rise in softwood log imports from the USA and
Canada.
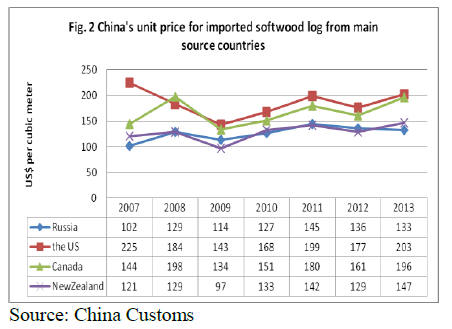
In terms of unit log price from the main source countries,
in 2013 prices for US logs fell to an average US$203 per
cubic metre.
However, imports from Canada, Russia and New Zealand
were all more expensive at US$196, US$133 and US $147
per cubic metre respectively.
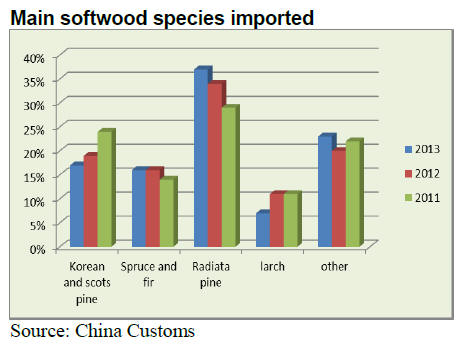
The main species of imported softwood logs were scots
pine, spruce and fir, radiata pine and larch and imports of
these species account for 77% of the total softwood log
imports.
Before 2007, scots pine was the main species imported but
between 2007 to 2013 imports of radiata pine rose sharply
and now account for about 37% of all softwood log
imports.
The figure below illustrates the changes in species
imported over time.
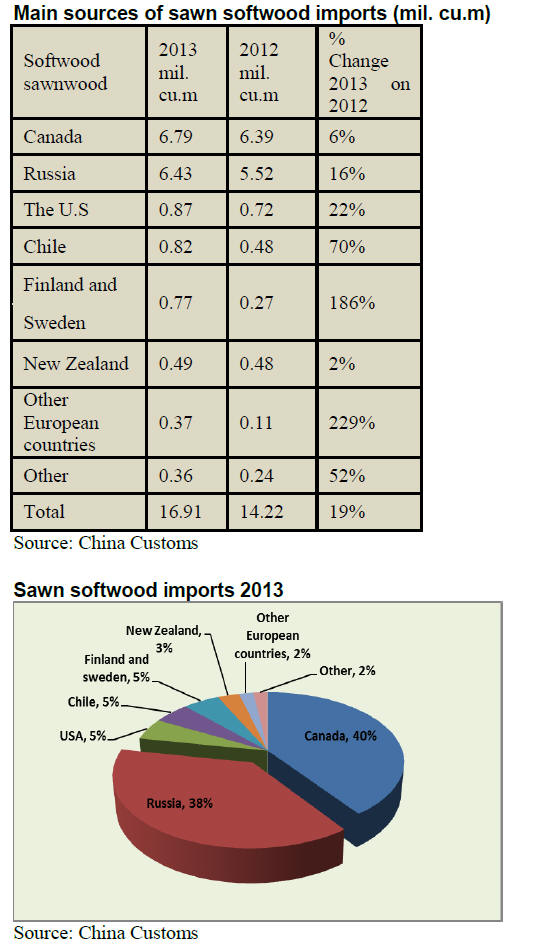
Sawn softwood imports
China‟s sawnwood imports were 23.95 million cubic
metres in 2013. Of this total, sawn softwood imports
accounted for about made up 70%.
Canada and Russia were the main suppliers of imported
sawn softwood in 2013 at 6.79 million cubic metres and
6.43 million cubic metres respectively.
The faster growth in sawn softwood imports was recorded
for Finland and Sweden (up 186% in 2013).
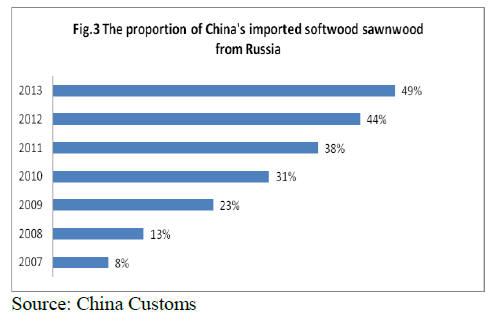
The proportion of China's imported sawn softwood from
Russia has been increasing since 2007. China‟s sawn
softwood imports from Russia in 2013 rose 16% over
2012.
Analysts forecast that China‟s sawn softwood imports
from Russia will exceed those from Canada this year and
it may be that Russia will become the largest supplier of
China‟s sawn softwood imports.
China‟s sawn spruce and fir imports have increased
rapidly in recent years. In 2013 some 92% of China‟s
spruce and fir imports were from Canada and amounted to
6.8 million cubic metres.
Imports of sawn spruce and fir from European countries
have been increasing and and last year totaled 1.91 million
cubic metres.
The pattern of China‟s sawn softwoodmarket has changed.
In 2013, 80% of Chin‟a sawn softwoodwas imported by
traders in Inner Mongolia, Jiangsu, Shanghai, Guangdong,
Tianjin, Shandong and Heilongjiang provinces.
Some 76% of China‟s scots pine sawnwood was imported
through Inner Mongolia while 56% of the spruce and fir
imports came through ports in Jiangsu, Shanghai and
Tianjin.
|