|
Report from
Europe
Tropical wood product imports down 19%
In the first nine months of this year, the EU27 imported
1,237,500 tonnes of tropical wood and wood furniture
products with a total value of US$2.50b, respectively 19%
and 28% less than the same period in 2022. The scale of
the decline in trade in the first nine months of this year is
partly due to imports being at historically high levels in
the first half of 2022, particularly when considered in
value terms.
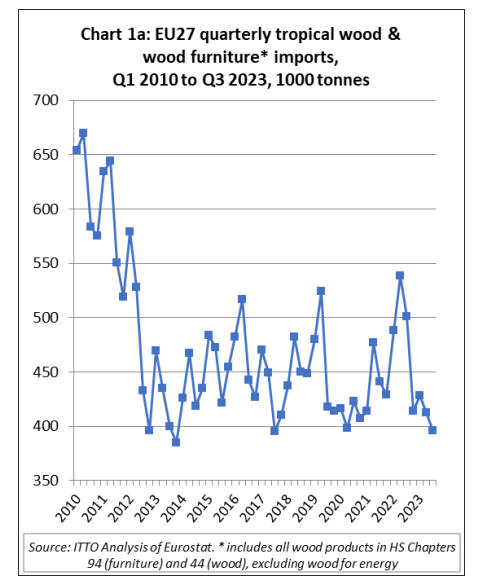
In quantity terms, EU27 imports of tropical wood and
wood furniture totalled 396,000 tonnes in the third quarter
of this year, 4% less than the previous quarter and 21%
down on the same quarter in 2022. The quantity of EU27
imports in the third quarter this year was well below the
long-term average of around 450,000 tonnes per quarter
during the 2012 to 2019 period. (Chart 1a).
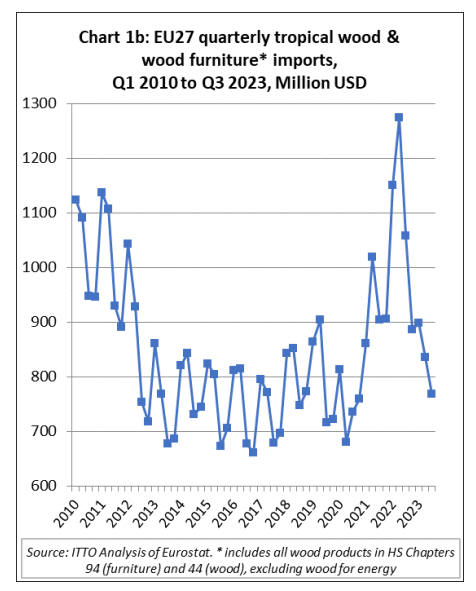
The total value of EU27 imports of tropical wood and
wood furniture was US$768m in the third quarter of this
year, 8% less than the previous quarter and 27% below the
same quarter last year. Despite the steep fall this year,
import value in the third quarter was at around the long-
term quarterly average between 2012 and 2019, the period
of relatively stagnant market conditions for tropical
products that prevailed in Europe before the COVID crises
(Chart 1b).
Overall, the trade data highlights that import prices for
tropical wood and wood furniture products in the EU27
market have remained relatively high this year despite
sharp falls in freight rates and declining consumption. This
is in line with broader inflationary trends impacting on the
EU market, particularly driven by high energy costs.
Another downward revision to EU economic forecasts,
recession looming.
The European Commission’s Autumn Economic Forecast
published on 15 November shows that the EU economy
has lost momentum following the robust post-pandemic
expansion in 2021 and 2022. GDP in the EU contracted
very mildly in the fourth quarter of 2022 and barely grew
in the first three quarters of this year. The high cost of
living took a heavier toll than expected. On the external
side, global trade provided little support. Meanwhile, the
response of monetary policy to high inflation is working
its way through the economy, and fiscal support is partly
being phased out.
The EC projects GDP growth in 2023 at 0.6% in both the
EU and the euro area. This is 0.2 percentage points lower
than projected in the summer and an even larger
downward revision compared to the Spring Forecast, by
0.4 percentage points. Going forward, the EC expects
growth to rebound mildly as consumption recovers with
rising real wages, investment remains supportive and
external demand picks up.
EU GDP growth is forecast to improve to 1.3% in 2024,
still below potential and a downward revision of 0.1
percentage points compared to the Summer Forecast. The
EC forecasts that 10 EU countries — including Germany
— will see their economies shrink this year. All except
Sweden are expected to grow in 2024.
Headline inflation in the EU is forecast by the EC to
decrease from 6.5% in 2023 to 3.5% in 2024 and 2.4% in
2025. The European Central Bank last hiked its policy
interest rates in September, by 25 bps. Interest rates are
thought to have peaked and are expected to ease gradually
now that inflation seems to be under control.
The loss of growth momentum so far this year reflects the
lack of any solid growth drivers in the economy. Domestic
consumption and investment in both the private and public
sectors are weak, and export trade is also down. Wage
growth has lagged behind inflation and retail sales are still
declining.
Spending on services has held up a little better partly due
to further recovery in tourist arrivals to the EU.
Manufacturing output in the EU has been held back by
weak demand and high energy costs. Similarly, high input
and financing costs, as well as labour shortages, are
dragging down construction activity, particularly in
housing.
According to the Financial Times, independent economists
are even more gloomy than the EC about prospects in the
EU. Carsten Brzeski, an economist at Dutch bank ING,
told the FT that “The commission’s forecasts still fall into
the category ‘unbeatable optimism’”. He forecast that
eurozone growth would reach just 0.2 per cent next year
when “we will still see the negative impact from higher
interest rates on growth”.
The HCOB Eurozone Construction PMI dropped from
43.6 in September to 42.7 in October, well below the 50-
mark which is the threshold for stable conditions and
signalling the fastest monthly decline in eurozone
construction activity since December 2022.
In line with the trend seen for over a year, the housing
sector remained a particular point of weakness. Firms in
Germany and France registered a particularly significant
decrease in output. German construction firms recorded
the sharpest fall in activity since April 2020.
Italy was alone in signalling growth in construction output.
Driving the downturn in output was a marked decline in
new orders, as demand conditions deteriorated.
Meanwhile, construction business confidence in the
eurozone worsened, with expectations at their joint-lowest
since last December.
Across the board decline in EU import value of tropical
wood products
There was a year-on-year decline in EU27 import value
for all tropical wood product groups except logs between
January and September this year (Chart 2a).
During the nine-month period, there were large declines in
EU27 import value for: wood furniture from tropical
countries (-38% to US$881m); tropical mouldings/decking
(-37% to US$213m); tropical joinery products (-33% to
US$153m); tropical-hardwood-faced plywood (-22% to
US$153m); tropical veneer (-20% to US$144m); tropical
marquetry (-18% to US$80m); and tropical flooring (-34%
to US$46m).
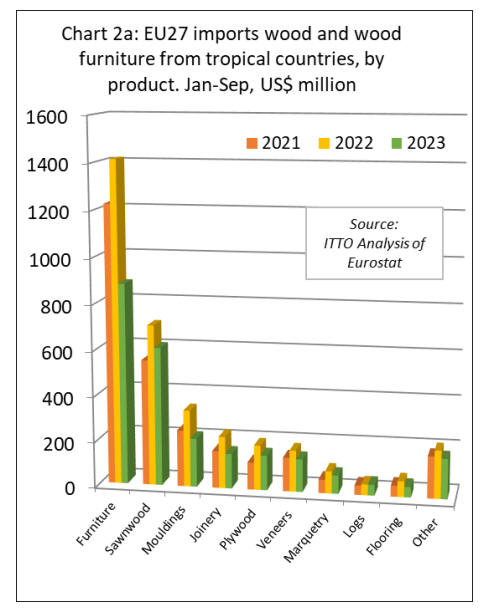
A more moderate decline was recorded in EU27 import
value of tropical sawnwood, by 14% to US$607m. EU27
import value of tropical logs increased 0.4% to US$47m
during the nine-month period.
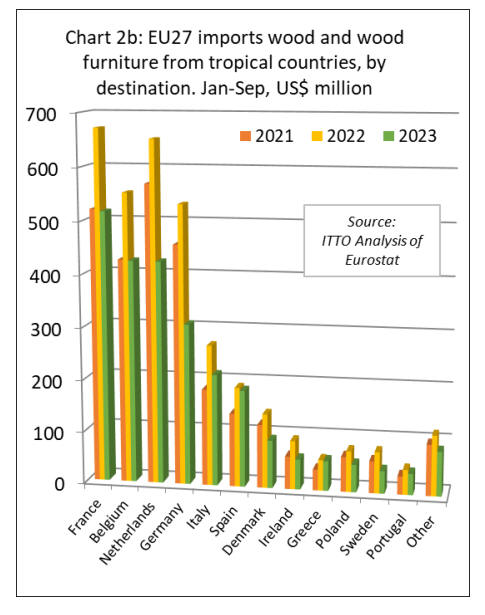
In terms of EU destinations, import value of tropical wood
and wood furniture in the first nine months this year was
down year-on-year in all the main markets. There were
relatively minor declines in Spain (-3% to US$185m) and
Greece (-3% to US$57m).
However, much larger falls were recorded in France (-23%
to US$517m), Belgium (-23% to US$425m), the
Netherlands (-35% to US$425m), Germany (-42% to
US$307m), Italy (-21% to US$213m), Denmark (-35% to
US$92m), Ireland (-40% to US$58m), Poland (-32% to
US$53m), Sweden (-45% to US$43m), and Portugal (-
15% to US$40m) (Chart 2b).
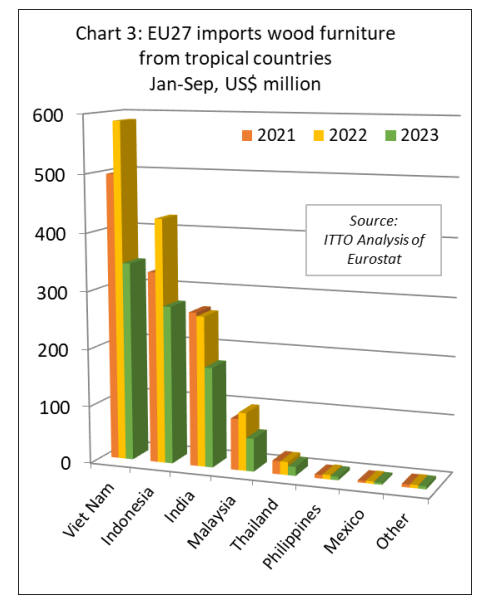
EU27 wood furniture imports from tropical countries
decline by 29%
In the first nine months of 2023, the EU27 imported
201,000 tonnes of wood furniture from tropical countries
with a total value of US$881m, down 29% and 38%
respectively compared to the same period in 2022.
Import value decreased 41% to US$345m from Vietnam,
35% to US$275m from Indonesia, 33% to US$174m from
India, 43% to US$57m from Malaysia, and 31% to
US$16m from Thailand. EU27 wood furniture imports
from all other tropical countries were negligible during the
nine-month period (Chart 3).
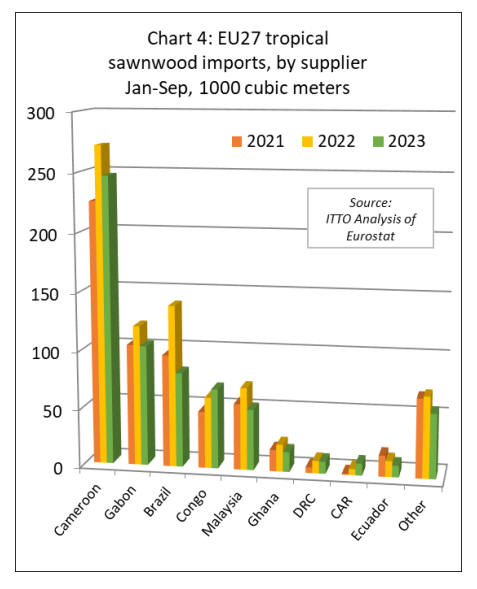
EU27 imports of tropical sawnwood down 14% this year
The EU27 imported 607,300 cubic metres of tropical
sawnwood in the first nine months of 2023, 14% less than
the same period in 2022.
Imports increased from Congo (+12% to 68,500 cubic
metres) and CAR (+98% to 10,300 cubic metres).
However, these gains were offset by declining imports
from Cameroon (-9% to 246,800 cubic metres), Gabon (-
14% to 103,300 cubic metres), Brazil (-41% to 81,300
cubic metres), Malaysia (-26% to 52,200 cubic metres),
Ghana (-26% to 17,100 cubic metres), DRC (-4% to
10,400 cubic metres), and Ecuador (-27% to 10,000 cubic
metres) (Chart 4).
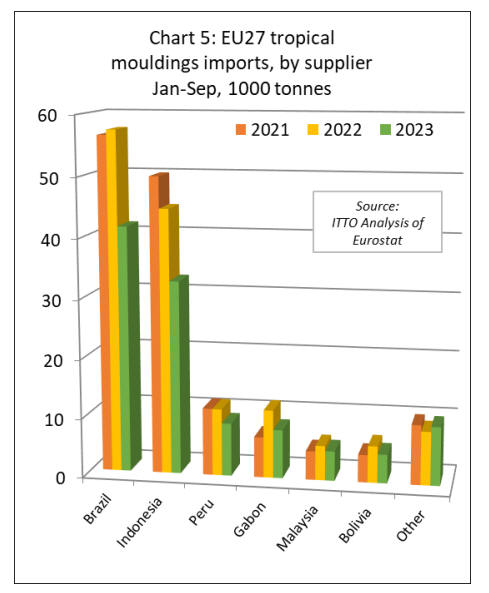
The EU27 imported 111,000 tonnes of mouldings/decking
in the first nine months of 2023, 24% less than the same
period last year. Imports fell sharply from all the leading
supply countries including Brazil (-28% to 41,500 tonnes),
Indonesia (-27% to 32,600 tonnes), Peru (-21% to 8,900
tonnes), Gabon (-29% to 8,200 tonnes), Malaysia (-14% to
5,000 tonnes), and Bolivia (-22% to 4,900 tonnes). (Chart
5).
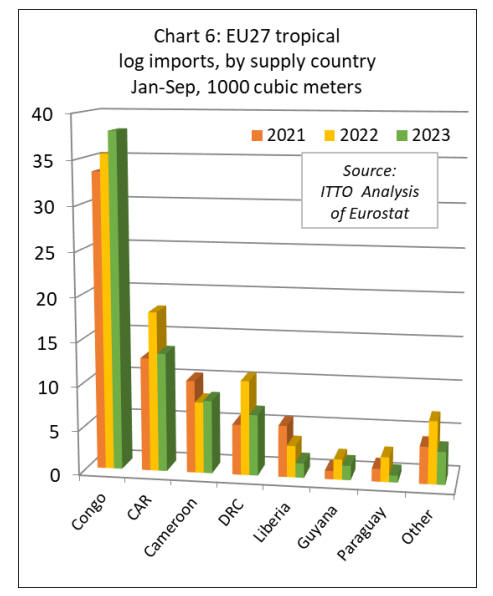
In the first nine months of 2023, the EU27 imported
74,400 cubic metres of tropical logs, 16% less than the
same period in 2022. A notable trend during the period
was a 7% rise in EU27 log imports from Congo to 38,000
cubic metres.
This rise in European arrivals – which was concentrated in
the first quarter of this year - reflects a last-minute effort to
ship logs in advance of the log export ban imposed by the
Republic of Congo from 1st January 2023. EU27 imports
of logs also increased slightly from Cameroon during the
nine-month period, up 3% to 8,300 cubic metres. These
logs may well be sourced from neighbouring Congo or
Central African Republic.
EU27 imports of tropical logs from all other supply
countries declined during the period including Central
African Republic (-26% to 13,400 cubic metres),
Democratic Republic of Congo (-36% to 6,900 cubic
metres), Liberia (-54% to 1,600 cubic metres), Guyana (-
29% to 1,600 cubic metres) and Paraguay (-72% to 780
cubic metres) (Chart 6).
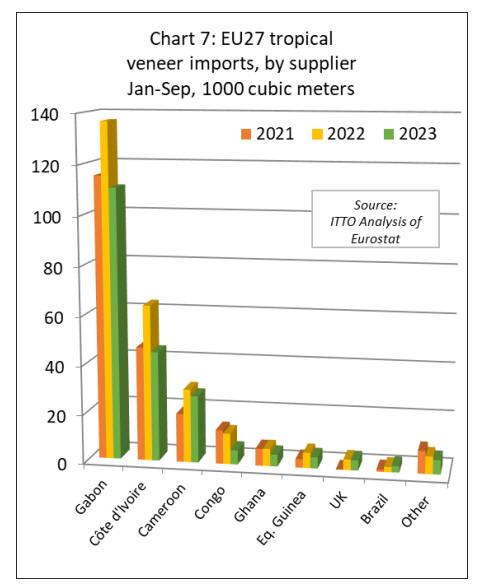
EU27 imports of tropical veneer down 22% and tropical
plywood down 10%
In the first nine months of 2023, the EU27 imported
210,600 cubic metres of tropical veneer, down 22%
compared to the same period last year. Imports of tropical
veneer from Gabon, by far the largest supplier to the
EU27, decreased 19% to 110,500 cubic metres after rising
sharply last year.
EU27 veneer imports in the first nine months of this year
also declined from Côte d'Ivoire (-30% to 44,800 cubic
metres), Cameroon (-9% to 27,400 cubic metres), Congo
(-54% to 5,800 cubic metres), Ghana (-32% to 4,800 cubic
metres), and Equatorial Guinea (-26% to 4,600 cubic
metres). However, imports from Brazil were up 23% to
2,600 cubic metres during the nine-month period (Chart
7).
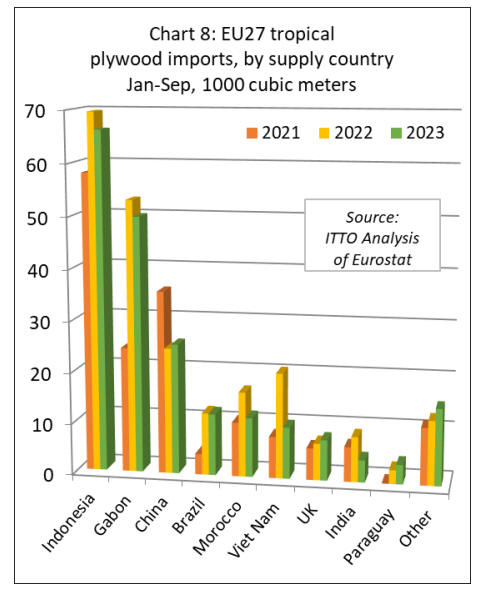
In the first nine months of 2023, EU27 tropical plywood
imports were 206,200 cubic metres, 10% less than in the
same period last year. Imports increased from China (+3%
to 25,400 cubic metres) and Paraguay (+42% to 3,800
cubic metres), while indirect imports via the UK were also
up 10% to 7,900 cubic metres.
However, imports from all the leading tropical supply
countries declined including Indonesia (-5% to 66,200
cubic metres), Gabon (-6% to 49,900 cubic metres), Brazil
(-1% to 12,000 cubic metres), Morocco (-30% to 11,600
cubic metres), Vietnam (-51% to 10,100 cubic metres),
and India (-51% to 4,300 cubic metres). (Chart 8).
EU27 imports of tropical laminated products decline from
all countries except Congo.
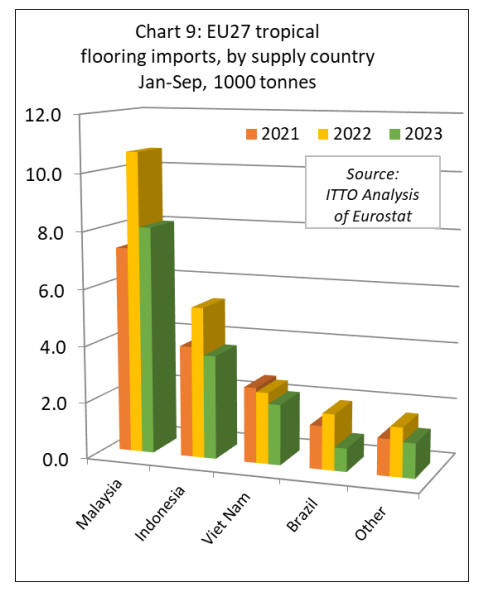
In the first nine months of 2023, the EU27 imported
15,900 tonnes of tropical wood flooring, down 28%
compared to the same period last year. The consistent rise
in EU27 wood flooring imports from Malaysia, that began
in 2020, has stalled this year. Imports of 8,000 tonnes from
Malaysia in the first nine months of 2023 were 25% less
than the same period in 2022. Imports also fell from
Indonesia (-31% to 3,700 tonnes), Vietnam (-15% to 2,100
tonnes), and Brazil (-59% to 820 tonnes) (Chart 9).
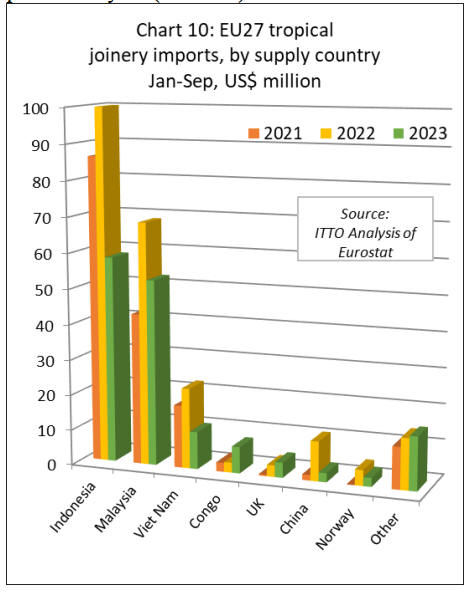
The value of EU27 imports of other joinery products from
tropical countries - which mainly comprise laminated
window scantlings, kitchen tops and wood doors –
declined 33% to US$153m in the first nine months of
2023. Imports were down 42% to US$58m from
Indonesia, down 23% to US$52m from Malaysia, down
54% to US$11m from Vietnam, and down 77% to less
than US$3m from China.
In a potentially significant longer-term development, given
efforts in the country to shift up the value chain as log
exports are banned, EU imports of laminated joinery
products from Congo were valued at US$7.5m in the first
nine months of this year, 170% more than during the same
period last year (Chart 10).
|