|
Report from
Europe
EU27 tropical wood product imports decline in first
half of 2023
In the first six months of this year, the EU27 imported
838,900 tonnes of tropical wood and wooden furniture
products with a total value of USD1.73b, respectively 18%
and 29% less than the same period in 2022. The scale of
the decline in trade in the first six months of this year is
partly due to imports being at historically high levels in
the first half of 2022, particularly when considered in
value terms.
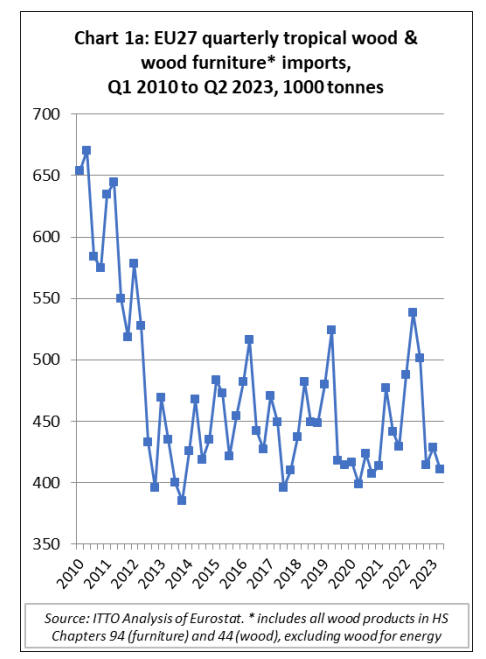
In quantity terms, EU27 imports of tropical wood and
wooden furniture totalled 410,000 tonnes in the second
quarter of this year, 4% less than the previous quarter and
24% down on the same quarter in 2022. The quantity of
EU27 imports in both the first and second quarters this
year was well below the long-term average of around
450,000 tonnes per quarter during the 2012 to 2019
period (Chart 1a).
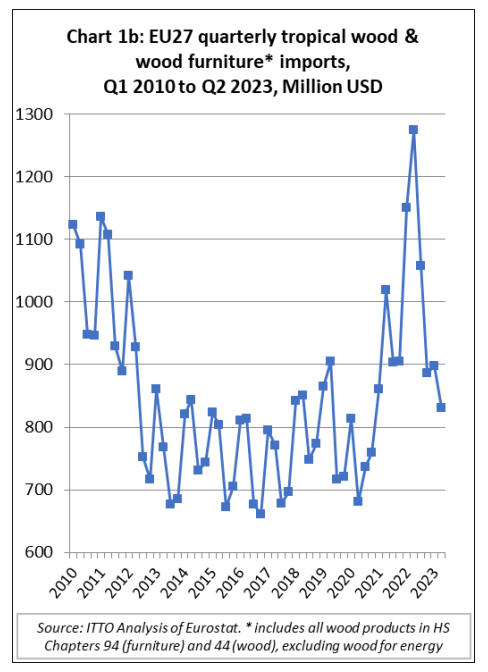
The total value of EU27 imports of tropical wood and
wooden furniture was USD831m in the second quarter of
this year, 7% less than the previous quarter and 35%
below the same quarter last year.
Despite the steep fall this year, import value in both the
first and second quarters was significantly above the long-
term average of around USD800m per quarter between
2012 and 2019, the period of relatively stagnant market
conditions for tropical products that prevailed in Europe
before the COVID crises (Chart 1b).
Overall, the trade data highlights that import prices for
tropical wood and wooden furniture products in the EU27
market remained relatively high in the first half of this
year despite sharp falls in freight rates and declining
consumption. This is in line with broader inflationary
trends impacting on the EU market, particularly driven by
high energy costs.
EU economy forecast to grow just 0.8% this year
The European Commission’s Summer Economic Forecast
published on 11 September indicates that inflation in the
EU, while still high, was easing in the first half of 2023 as
a result of declining energy prices and moderating
inflationary pressures from food and industrial goods. In
the euro area, the annualised inflation rate reached 5.3% in
July, exactly half of the peak level of 10.6% recorded in
October 2022, and remained stable in August.
According to the EC Forecast, energy prices are set to
continue declining for the remainder of 2023, but at a
slowing pace and they may increase slightly again in 2024,
driven by higher oil prices. Inflation in services has so far
been more persistent than previously expected, but it is set
to continue moderating as demand softens under the
impact of monetary policy tightening and a fading post-
COVID boost.
The EC Forecast suggests that the EU economy continues
to grow, albeit with reduced momentum. It revises growth
in the EU economy down to 0.8% in 2023, from 1%
projected in the EC’s Spring Forecast, and 1.4% in 2024,
from 1.7%. The latest Forecast confirms that economic
activity in the EU was subdued in the first half of 2023.
Domestic consumption was weak as tightening monetary
policy has restricted the provision of bank credit to the
economy.
The EC Forecast also highlights that survey indicators
now point to slowing economic activity in the summer and
the months ahead, with continued weakness in industry
and fading momentum in services. This is despite a strong
tourism season in many parts of Europe, declining energy
prices, and an exceptionally strong labour market. The EU
currently has record low unemployment rates and wages
have continued to expand.
The EC Forecast also notes that the global economy has
fared somewhat better than anticipated in the first half of
the year, despite a weak performance in China. However,
the outlook for global growth and trade remains broadly
unchanged compared to spring, implying that the EU
economy cannot count on strong support from external
demand.
Overall, the EC Forecast concludes that “the weaker
growth momentum in the EU is expected to extend to
2024, and the impact of tight monetary policy is set to
continue restraining economic activity. However, a mild
rebound in growth is projected next year, as inflation
keeps easing, the labour market remains robust, and real
incomes gradually recover. Russia's ongoing war against
Ukraine and wider geopolitical tensions continue to pose
risks and remain a source of uncertainty”.
Meanwhile, the construction sector in the EU is
performing poorly. The HCOB Eurozone Construction
PMI edged down to 43.4 in August 2023, well below the
50-mark which is the threshold for stable conditions and
down from the previous month's 43.5. This was the
sixteenth successive deterioration in total activity and the
lowest reading since December 2022.
Housing activity in August posted the fastest pace of
contraction since April 2020, while commercial works and
infrastructure activity declined more slowly. New orders
decreased for the seventeenth successive month, but at
slower pace, and buying levels declined the most since
May 2020. Overall, businesses maintained a pessimistic
outlook for the next 12 months, citing tight financial
conditions, limited investment, and economic uncertainty
as contributing factors.
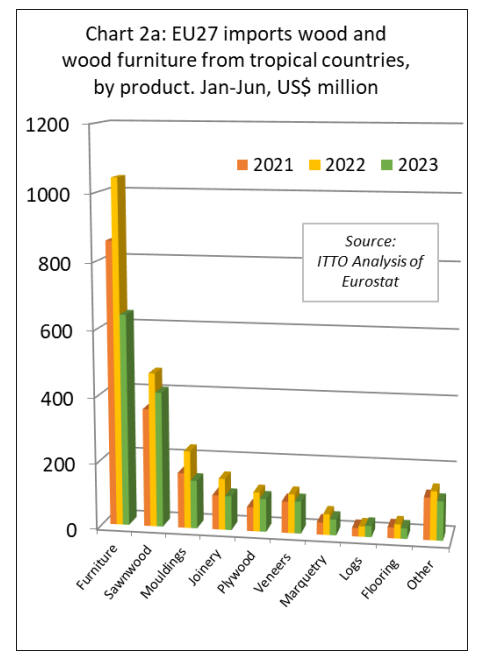
Particularly large fall in EU import value of secondary
and tertiary tropical products
There was a year-on-year decline in EU27 import value
for all tropical wood product groups except logs between
January and June this year (Chart 2a).
Overall, the decline in import value was more severe for
secondary and tertiary processed products than for primary
processed products.
During the six-month period, there were large declines in
EU27 import value for: wooden furniture from tropical
countries (-39% to USD640m); tropical
mouldings/decking (-38% to USD146m); tropical joinery
products (-33% to USD104m); tropical marquetry (-24%
to USD48m); and tropical flooring (-26% to USD32m).
More moderate declines were recorded for EU27 imports
of tropical sawnwood (-12% to USD409m), tropical-
hardwood-faced plywood (-16% to USD100m); and
tropical veneer (-18% to USD97m). EU27 import value of
tropical logs increased 9% to USD34m during the six-
month period.
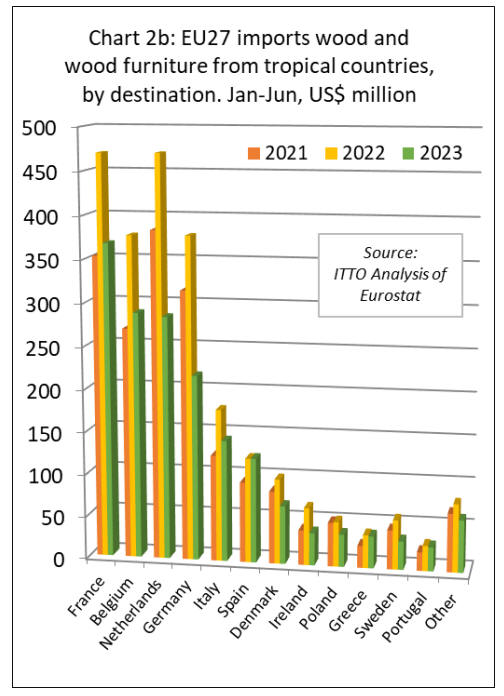
In terms of EU destinations, import value of tropical wood
and wooden furniture in the first six months this year was
down year-on-year in all the main markets except Spain
where import value increased marginally (+0.3% to
USD123m). Elsewhere there was a relatively minor
decline in Greece (-3% to USD38m) and Portugal (-5% to
USD28m).
Much larger falls in import value were recorded in France
(-22% to USD368m), Belgium (-24% to USD288m), the
Netherlands (-40% to USD285m), Germany (-43% to
USD217m), Italy (-20% to USD142m), Denmark (-32% to
USD68m), Ireland (-43% to USD38m), Poland (-28% to
USD38m), and Sweden (-42% to USD34m) (Chart 2b).
EU27 wooden furniture imports from tropical countries
decline by more than 30%
In the first six months of 2023, the EU27 imported
143,000 tonnes of wooden furniture from tropical
countries with a total value of USD640m, down 32% and
39% respectively compared to the same period in 2022.
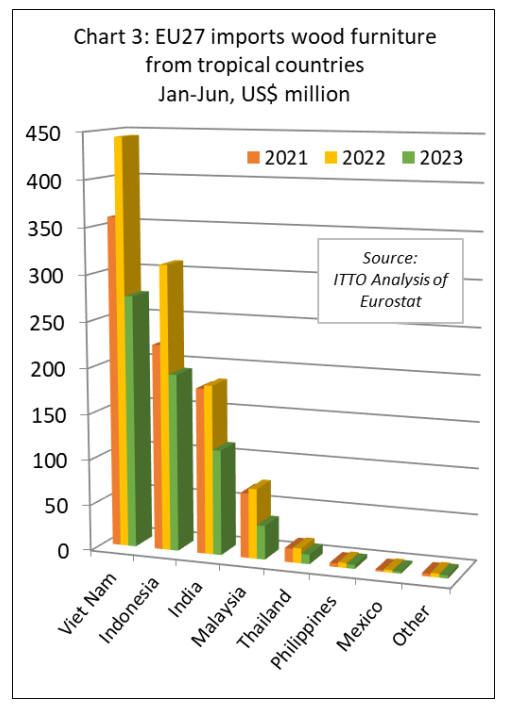
Import value decreased 38% to USD275m from Vietnam,
38% to USD193m from Indonesia, 38% to USD115m
from India, 52% to USD37m from Malaysia, and 35% to
USD11m from Thailand. EU27 wooden furniture imports
from all other tropical countries were negligible during the
six-month period (Chart 3).
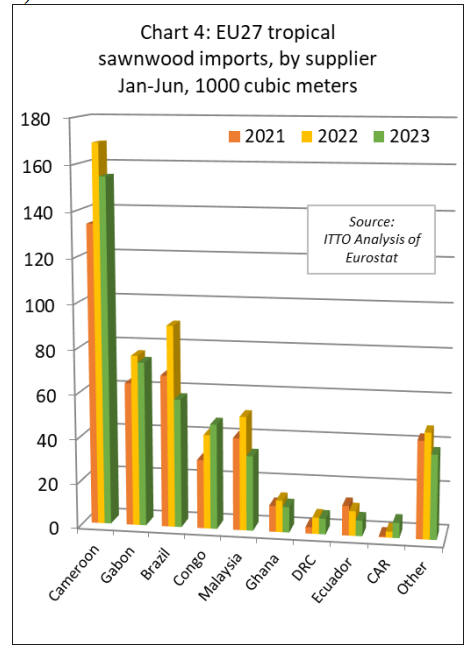
Slowing EU27 imports of tropical sawnwood and
mouldings
The EU27 imported 436,700 cubic metres of tropical
sawnwood in the first six months of 2023, 15% less than
the same period in 2022. Imports increased from Congo
(+12% to 47,100 cubic metres) and CAR (+154% to 6,800
cubic metres).
However, these gains were offset by declining imports
from Cameroon (-9% to 154,700 cubic metres), Gabon (-
4% to 73,600 cubic metres), Brazil (-36% to 57,600 cubic
metres), Malaysia (-34% to 33,600 cubic metres), Ghana (-
19% to 11,500 cubic metres), DRC (-5% to 7,000 cubic
metres), and Ecuador (-37% to 7,000 cubic metres) (Chart
4).
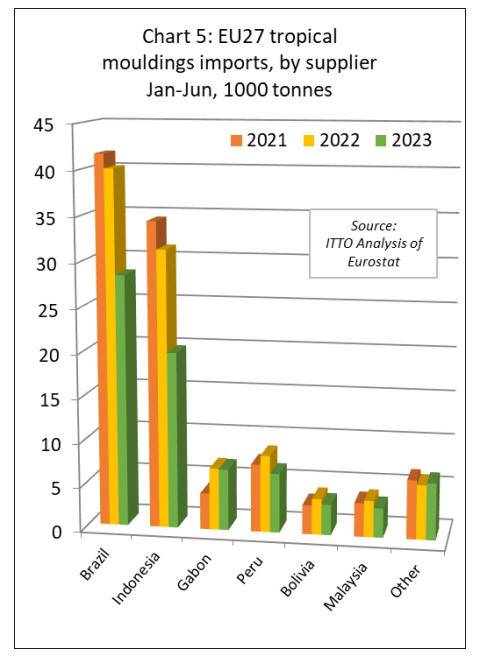
The EU27 imported 75,000 tonnes of mouldings/decking
in the first six months of 2023, 26% less than the same
period last year. Imports from the two largest supply
countries fell sharply: down 29% to 28,400 tonnes from
Brazil; and down 37% to 19,900 tonnes from Indonesia.
Imports from Gabon fell more slowly, down 1% to 6,900
tonnes. There was a sharp fall in imports from Peru (-23%
to 6,700 tonnes), Bolivia (-15% to 3,500 tonnes), and
Malaysia (-19% to 3,300 tonnes) (Chart 5).
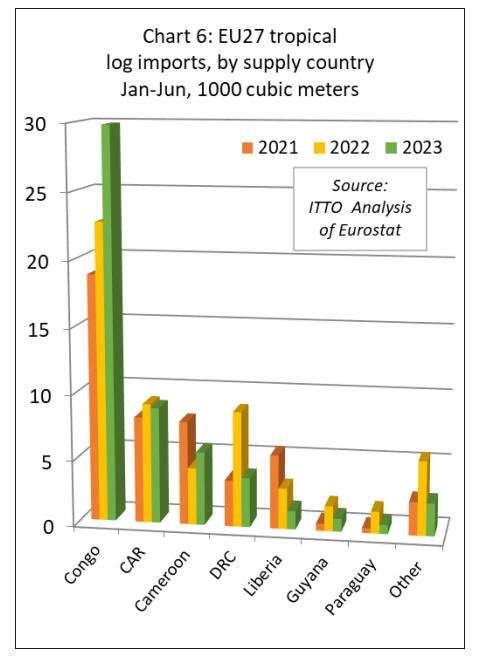
In the first six months of 2023, the EU27 imported 53,500
cubic metres of tropical logs, 6% less than the same period
in 2022. The most significant trend during the period was
a sharp 31% rise in EU27 log imports from Congo to
30,000 cubic metres.
This surge in European arrivals – which was concentrated
in the first quarter of this year - probably reflects a last-
minute effort to ship logs in advance of the log export ban
imposed by the Republic of Congo from 1st January 2023.
EU27 imports of logs also increased sharply from
Cameroon (which may be derived from neighbouring
Congo or Central African Republic) in the first six months
this year, rising 29% year-on-year to 5,600 cubic metres.
EU27 imports of tropical logs from all other supply
countries declined during the period including Central
African Republic (-3% to 8,800 cubic metres), Democratic
Republic of Congo (-57% to 3,800 cubic metres), Liberia
(-55% to 1,400 cubic metres), Guyana (-48% to 1000
cubic metres) and Paraguay (-58% to 700 cubic metres)
(Chart 6).
Downturn in EU27 imports of tropical veneer but
plywood more stable
In the first six months of 2023, the EU27 imported
142,400 cubic metres of tropical veneer, down 18%
compared to the same period last year. Imports of tropical
veneer from Gabon, by far the largest supplier to the
EU27, decreased 20% to 73,300 cubic metres after rising
sharply last year.
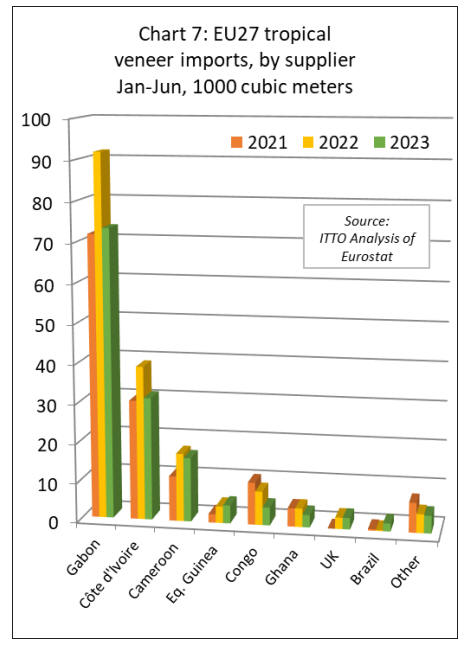
EU27 veneer imports in the first six months of this year
also declined from Côte d'Ivoire (-20% to 31,100 cubic
metres), Cameroon (-6% to 16,200 cubic metres), Congo
(-47% to 4,600 cubic metres), and Ghana (-33% to 3,200
cubic metres).
However, imports from Equatorial Guinea increased by
9% to 4,600 cubic metres and imports from Brazil were up
sharply from negligible levels last year to 2,000 cubic
metres in the first six months of this year (Chart 7)
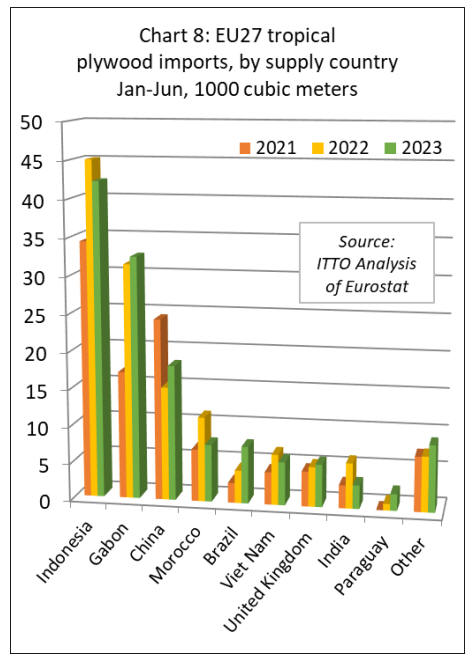
In the first six months of 2023, EU27 tropical plywood
imports were 134,200 cubic metres, unchanged from the
same period last year. Imports from Indonesia, at 42,300
cubic metres, were down 6% compared to the same period
last year. Imports also fell from Morocco (-32% to 7,700
cubic metres), Vietnam (-14% to 5,800 cubic metres), and
India (-48% to 3,200 cubic metres).
However, imports increased from Gabon (+3% to 32,500
cubic metres), China (+19% to 18,100 cubic metres), and
Brazil (+74% to 7,700 cubic metres) (Chart 8).
EU27 imports of tropical laminated products decline
from all countries except Congo
In the first six months of 2023, the EU27 imported 11,000
tonnes of tropical wood flooring, down 20% compared to
the same period last year. The consistent rise in EU27
wood flooring imports from Malaysia that began in 2020
has stalled this year.
Imports of 5,700 tonnes from Malaysia in the first six
months of 2023 were 13% less than the same period in
2022. Imports also fell from Indonesia (-28% to 2,300
tonnes), Vietnam (-16% to 1,700 tonnes), and Brazil (-
39% to 580 tonnes) (Chart 9).

The value of EU27 imports of other joinery products from
tropical countries - which mainly comprise laminated
window scantlings, kitchen tops and wood doors –
declined 33% to US$104m in the first six months of 2023.
Imports were down 44% to US$40m from Indonesia,
down 18% to US$37m from Malaysia, down 52% to
US$7m from Vietnam, and down 78% to less than US$2m
from China.
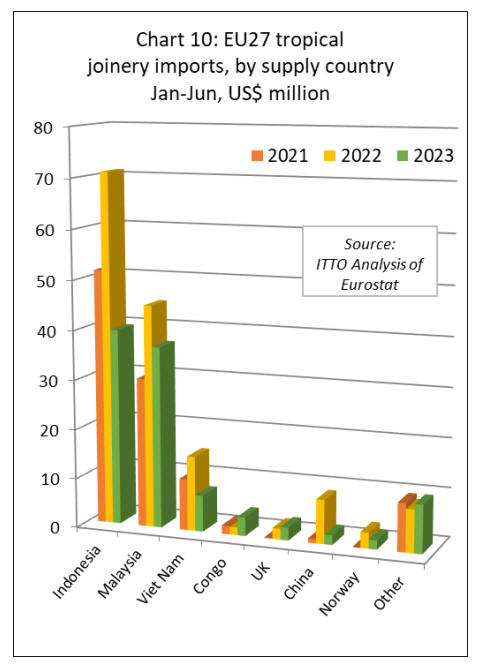
In a potentially significant longer-term development, given
efforts in the country to shift up the value chain as log
exports are banned, EU imports of laminated joinery
products from Congo were valued at US$3.7m in the first
six months of this year, 140% more than during the same
period last year (Chart 10).
|