|
Report from
North America
April brings more relief to US imports
US imports of tropical hardwood and related products showed
gains for a second month in April but still remain far below last year’s
levels. Imports of tropical hardwood, hardwood plywood, wooden furniture
and tropical hardwood veneer all rose in the 9%-15% range in April. But
through the first four months of the year, these imports are
considerably behind 2022 year-to-date numbers. Numbers are trending in
the right direction, but there is still plenty of ground to make up.
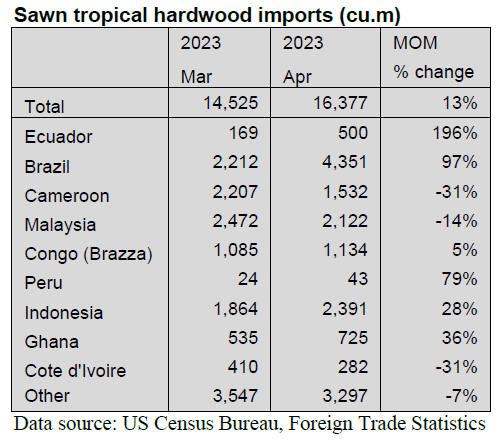
Sawn tropical hardwood imports halt slide
US imports of sawn tropical hardwood rose 13% in April, gaining
for a second consecutive month to continue a recovery from several
months of decline. The 16,377 cubic metres imported in April was 37%
below the volume from April 2022.
A rise of 97% in imports from Brazil accounted for most of the gain,
although imports from Ecuador, Indonesia, and Ghana also showed
significant growth. Even with the monthly gains, imports from all major
trading partners are lagging behind 2022 totals through the first four
months of the year—with the two biggest traders, Brazil and Indonesia,
down 46% and 76%, respectively.
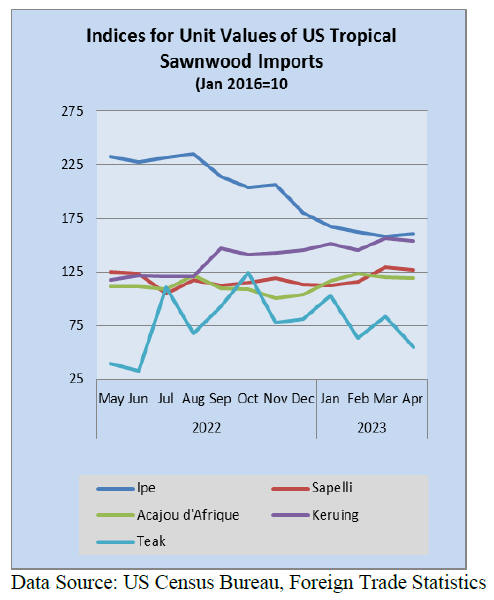
Imports of Balsa tripled in April, but that barely brought the monthly
volume to 1% above that of last April. Imports of Ipe and Sapelli also
gained while imports of Mahogany, Teak and Acajou d’Afrique declined in
April. Imports of Mahogany, Cedro and Keruing remain ahead of last
year’s totals through March, while imports of all other tropical
hardwoods are behind, many by significant margins. Imports of Ipe, for
example, are off by 66%.
Overall, US sawn tropical hardwood imports are down 41% from last year
through April.
Canada’s imports of sawn tropical hardwood fell 28% in April, reversing
their gains from the previous month. Imports were 19% lower than the
previous April, as imports of Sapelli, Virola, Imbuia and Balsa all fell
by about a third from the previous month. Year-to-year imports, which
were ahead of 2022 by 10% last month, are now only up 2%.
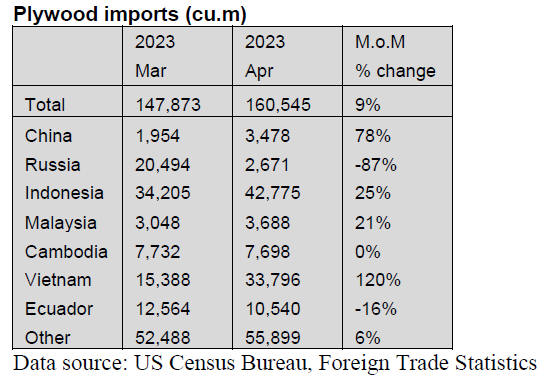
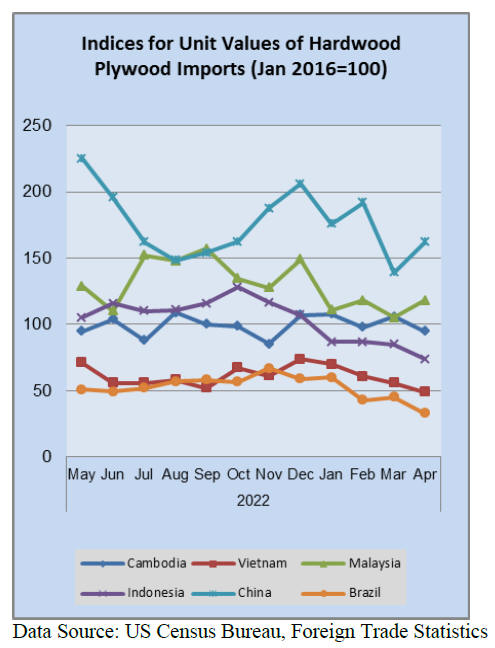
Hardwood plywood imports gain
US imports of hardwood plywood rose for a second straight
month, gaining 9% in April. While the trend is encouraging, the 160,545
cubic metres of plywood imported last month is nearly 60% less than the
over 396,000 cubic metres imported in April 2022.
Imports from Vietnam, China, Indonesia, and Malaysia all showed
significant improvement, but a further drop of imports from Russia
tempered those gains. Total imports for the first four months of the
year are down 63% versus 2022, with imports from most major supplying
countries down in the 60% to 80% range.
Veneer imports up 9% in April
US imports of tropical hardwood veneer grew 9% by value in
April on a spike in imports from Cameroon. Imports from Cameroon rose
more than 4,000% and accounted for more than a third of all veneer
imports in April. Imports from India, which have been down considerably
this year, more than doubled in April.
Imports from Cote d’Ivoire rose 44% in April and are outperforming 2022
by 347% so far this year. Imports from Italy remain volatile from month
to month, falling sharply in April. Total imports are up 25% year to
year through April.
Hardwood flooring edges up
US imports of hardwood flooring edged up 2% by value in April.
Nearly 42% higher than imports from April 2022, hardwood flooring is one
of the few areas of consistent growth in 2023. Imports from China and
Brazil, which have been lagging so far this year, showed the biggest
growth in April, while imports from Indonesia and Malaysia continued to
show steady growth. Imports from Indonesia are up over 300% so far this
year. Total imports of hardwood flooring are up 15% over last year
through April.
Imports of assembled flooring panels fell 10% in April, despite gains
from most major trading partners. While imports from the biggest
supplying nations all rose—imports from Vietnam up 72%, Indonesia up
18%, and Thailand up 15%—they are all still well below imports from last
April and far behind year-to-year imports versus 2022.
A dive into the numbers shows that the April downtick was due to a 35%
drop in imports from smaller supplying countries around the world such
as Italy and Austria. Total imports of assembled flooring panels remain
behind 2022 by 43%.
Moulding imports end slide, gain 11%
US imports of hardwood moulding saw an 11% value gain in April,
ending a six-month slide. Imports from Malaysia and Canada both gained
more than 10% for the month. Imports from China, which fell sharply in
March, quadrupled in April to recover, while imports from Brazil
continued downward, dropping by nearly 50% for a second month in a row.
Total imports are down 33% so far this year versus last year.
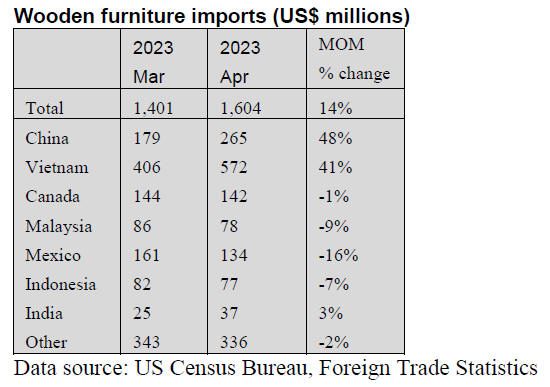
Wooden furniture imports gain on surge from China and Vietnam
US imports of wooden furniture ended their skid in April on
stronger numbers from China and Vietnam. While the US$1.604 billion in
April imports was 30% less than April 2022 totals, it was 14% above that
of the previous month. Imports from China rose 48% in April and imports
from Vietnam rose 41%.
However, even with the gain, imports from the two countries are far
behind their April 2022 levels and their 2022 totals through the first
four months of the year. Total wooden furniture imports are down 29% so
far this year versus 2022.
US cabinet sales down 3.5% in April
According to the Kitchen Cabinet Manufacturer's Association's
(KCMA) monthly Trend of Business Survey, participating cabinet
manufacturers reported a decrease in sales of 3.5% in April. Sales were
up by 8.6% for April 2023 compared to the same month in 2022.
The survey reported that compared with the previous month custom sales
were down 23%, semi-custom sales were up 8.2% and stock sales were down
7.1%. Compared with April 2022 custom sales were up 2.5%, semi-custom
sales were up 20.4% and stock sales were down 17.2%
In an analysis by Woodworking Network, economic concerns combined with
ongoing labor and supply chain issues are leaving cabinet manufacturers
with a cautious outlook for 2023 of flat or small gains compared to the
year prior.
See:
https://kcma.org/insights/february-trend-business-report
and
https://www.woodworkingnetwork.com/cabinets/kcma-sales-year-over-year-down-month-over-month
|