|
Report from
Europe
EU27 imports close to record levels
EU27 imports of tropical wood and wooden furniture
products in the first six months were at the highest level
for a decade. But perhaps surprisingly, even this has not
led to an increase in share for tropical products in the EU
market. EU27 imports from non-tropical countries have
increased even more rapidly.
In fact, the extraordinary market conditions that have
emerged during the COVID-19 pandemic have driven total
EU27 imports of wood and wooden furniture products this
year close to the record levels of 2007 and 2008, just prior
to the global financial crises.
Total EU27 import value of wood and wooden furniture in
the first six months of this year was US$9.7 billion, 38%
more than in the same period in 2020. Import value of
tropical products was US$1.88 billion, 26% more than the
same period in 2020. However import value from nontropical
regions was US$7.82 billion, a 42% increase.
Imports were up by 44% from China to US$2.42 billion,
by 50% from Russia to US$1.43 billion, by 71% from
Belarus to US$810 million, and by 50% from Ukraine to
US$770 million.
Of course, the comparison to a particularly slow trading
period during the first lockdown last year makes this year's
rise seem even larger. But trade this year is unprecedented
even compared to the long-term. Total EU27 imports
were valued at US$1.86 billion in June this year, by far the
largest amount of any single month in the last decade
(Chart 1).
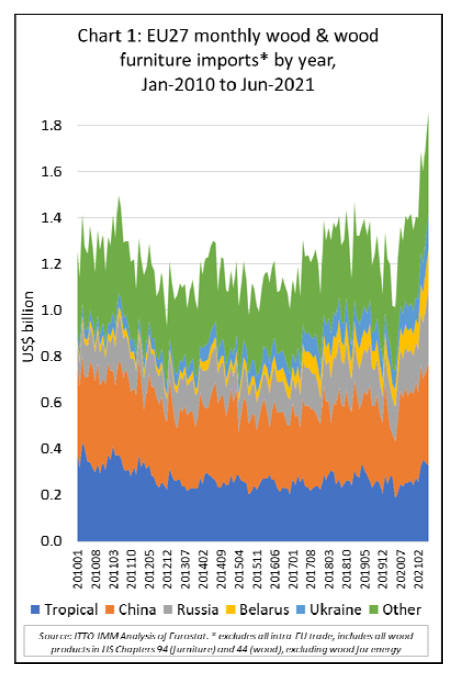
Monthly import values this high have only ever before
been seen in the boom years of 2007 and 2008, just before
the crash brought on by the global financial crises.
Positive signs of EU recovery
The sharp rise in the value of EU27 wood product imports
this year is partly due to rising timber product prices, the
dramatic and unprecedented increases in freight rates from
October last year, and to the arrival of a backlog of orders
delayed during the pandemic. However, it also comes at a
time when more positive signs are emerging on the
demand side as the economic recovery in the EU gains
momentum.
This trend is expected to continue as vaccination rates are
rising, lockdown measures are eased and the full effects of
NextGenerationEU, the EUˇŻs large fiscal stimulus
programme, begin to be felt.
According to the EUˇŻs ˇ®Summer 2021 Economic ForecastˇŻ
published in July, following a 6.0% decline in 2020, the
EU economy is now forecast to expand by 4.8% in 2021
and by 4.5% in 2022. This represents a significant upgrade
of the growth outlook compared to the ˇ®Spring 2021
Economic ForecastˇŻ which the Commission presented in
May.
The contraction of EU GDP in the first quarter of this year
turned out to be marginal and milder than expected.
Upbeat survey results among consumers and businesses,
as well as data tracking mobility, suggest that a rebound in
consumption is already underway and set to strengthen in
the coming months.
There is also evidence of a beginning revival in tourism
activity, which should also benefit from the new EU
Digital COVID Certificate. Together, these factors are
expected to outweigh the temporary production input
shortages and rising costs hitting parts of the
manufacturing sector.
Economic growth rates will continue to vary across the
EU. Some Member States (e.g. Germany, Netherlands,
Sweden, Denmark, Poland) are now expected to see
economic output return to their pre-pandemic levels by the
end of 2021. Others (e.g. Spain, France, Italy, Portugal)
will take longer, but all should see their economies return
to pre-crisis levels before the end of 2022.
According to the EU's forecast, uncertainty and risks
surrounding the growth outlook are high but remain
overall balanced. The threat posed by the spread and
emergence of variants of concern underscores the
importance of a further rapid increase in full vaccination.
Economic risks relate in particular to the response of
households and firms to changes in restrictions and the
impact of emergency policy support withdrawal.
Forward looking indicators show that economic
momentum in the EU27 has picked up since the start of
the year, although business and consumer confidence is
still quite fragile, particularly in the construction sector, a
key driver of timber demand in the region.
At 49.8 in July, the IHS Markit Eurozone Construction
Total Activity Index fell from 50.3 in June and pointed to
a marginal reduction in overall construction activity.
This marked the first fall in Eurozone construction activity
since February, with companies often linking the decline
to rising costs and raw material shortages. On a brighter
note, Eurozone construction firms remained confident that
activity will increase over the next 12 months amid
forecasts of strengthening economic conditions, improved
supplier performance and new projects.
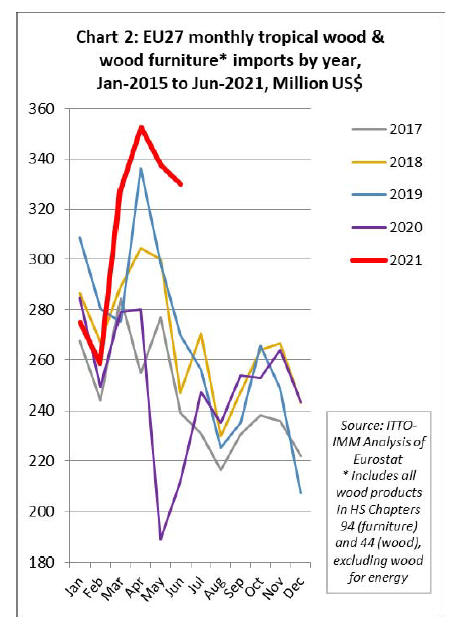
Highest EU tropical imports since 2012
EU27 imports of tropical wood and wooden furniture
started this year slowly in January and February but surged
to US$327 million in March and then again to US$353
million in April, the highest monthly import recorded
since January 2012. Import value fell away only slightly to
US$338 million in May and US$330 million in June
(Chart 2).
The value of EU27 imports of most tropical wood
products increased in the first six months of 2021
compared to the same period in 2021. For wooden
furniture, joinery and flooring from tropical countries,
imports were higher even than in 2019 before the
pandemic.
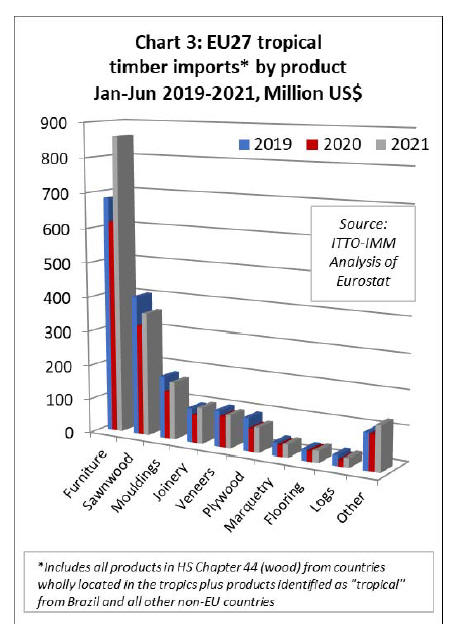
In the first 6 months of 2021, EU27 import value of
wooden furniture from tropical countries was US$859
million, 39% and 26% higher than the same period in 2020
and 2019 respectively. For tropical joinery products,
import value of US$105 in the first 6 months this year was
29% and 6% higher than the same period in 2020 and
2019 respectively.
For tropical wood flooring, import value of US$33 million
in the first 6 months this year was 15% higher than in
2020 and 5% higher than in 2019.
EU27 imports of other tropical wood products in the first
six months of 2021 were higher than the same period last
year but still down on levels achieved in 2019.
Import value of tropical sawnwood was US$358 million,
up 12% on 2020 but down 11% on 2019.
Import value of tropical mouldings was US$167 million,
up 21% on 2020 but down 8% on 2019.
Import value of tropical veneer was US$95 million, 7%
more than in 2020 but 9% less than 2019.
Import value of plywood was US$73 million, up 8%
compared to 2020 but down 24% on 2019.
Import value of tropical marquetry was US$37 million,
15% more than 2020 but 2% less than 2019.
Import value of tropical logs was US$26 million, 44% up
on 2020 but 12% less than 2019 (Chart 3).
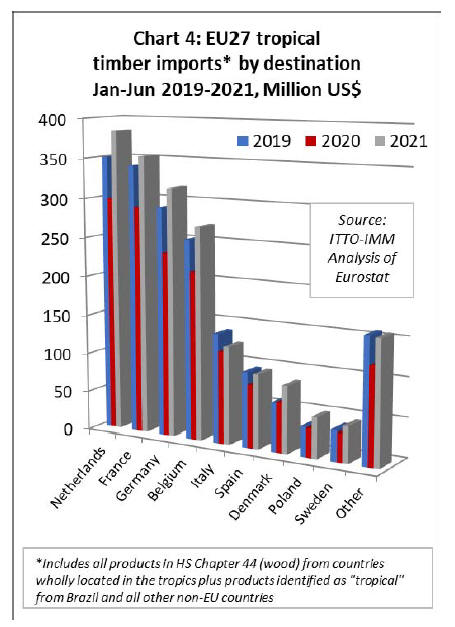
In the first six month this year, import value into all the
largest EU27 destinations for tropical wood and wooden
furniture products was higher than in the same period in
2020. Even more remarkable, of the largest markets, only
in Italy was import value in the first half of this year less
than in the same period in 2019 before the pandemic.
In the first six months of 2021, import value was up 28%
in the Netherlands to US$384 million, 22% to US$353
million in France, 35% in Germany to US$316 million,
27% in Belgium to US$270 million, 6% in Italy to
US$124 million, 18% in Spain to US$94 million, 34% to
US$85 million in Denmark, 41% in Poland to US$51
million, and 27% in Sweden to US$46 million. (Chart 4).
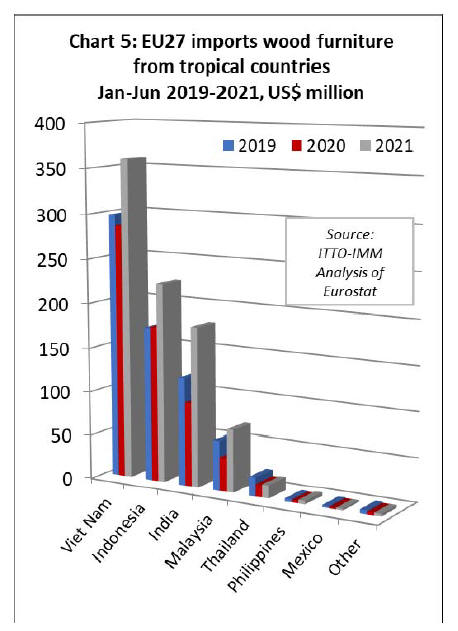
Strong recovery in EU27 wooden furniture imports
from tropical countries
After a slow start to the year, the value of EU27 wooden
furniture imports from the two largest tropical suppliers ¨C
Vietnam and Indonesia ¨C increased sharply in the second
quarter. By the end of the first 6 months, import value was
up 26% from Vietnam to US$360 million and up 28%
from Indonesia to US$224 million.
Meanwhile imports from India and Malaysia, already
strong in the first quarter this year, continued to rise
sharply in the second quarter.
After six months this year, import value from India was
US$180 million, 91% greater than the same period in
2020, while import value from Malaysia was US$71
million, a gain of 83%.
For all four leading tropical suppliers, EU27 wooden
furniture import value in the first 6 months of 2021 was
higher even than in 2019 before the pandemic (Chart 5).
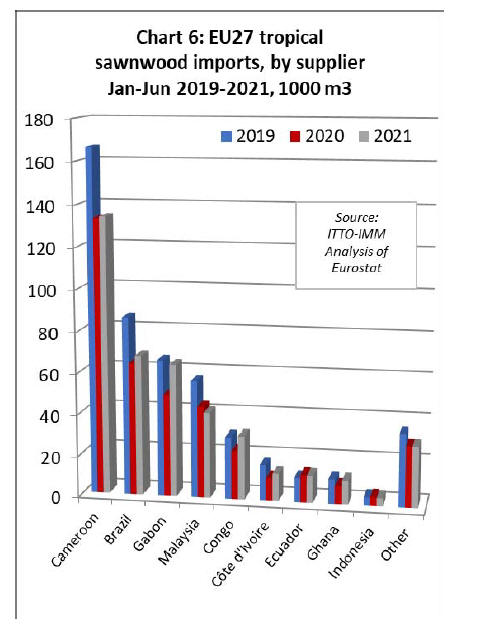
EU27 imports of sawnwood less impressive on a
volume basis
EU27 import performance of tropical sawnwood so far
this year is rather less impressive when considered on a
volume basis. Total imports of 410,000 cu.m in the first 6
months were 7.4% higher than the same period in 2020 but
still down nearly 16% compared to the same period in
2019 before the pandemic.
Imports of 134,000 cu.m of sawnwood from Cameroon in
the first 6 months this year were just 1% higher than the
same period in 2020 and still 19% down compared to
2019. Imports of 68,000 cu.m from Brazil were up 6%
compared to 2020 but down 21% compared to 2019.
Sawnwood imports from Gabon and Congo fared a little
better during the first six months of this year. Imports from
Gabon, at 64,000 cu.m, were up 29% on 2020 and down
only 3% compared to 2019. For the Congo, imports were
31,000 cu.m in the six month period, up 31% on 2020 and
2% on 2019.
Imports of sawnwood from Côte d'Ivoire were 13,500
cu.m in the first 6 months of this year, up 22% compared
to 2020 but down 23% on 2019. The long term decline in
EU27 imports of sawnwood from Malaysia continued in
the first 6 months this year, at 41,100 cu.m 6% less than
the same period in 2020 and 27% down on 2019 (Chart 6).
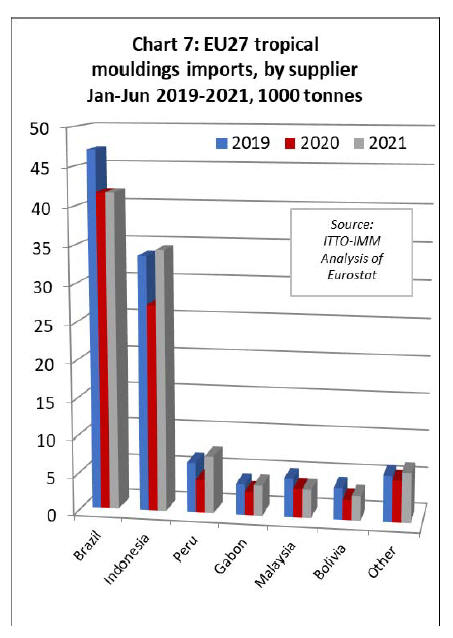
EU27 imports of tropical mouldings/decking increased
15% to 101,500 tonnes in the first half of this year
compared to last.
However import quantity was still down 5% compared to
2019. Imports of 41,600 tonnes from the largest supplier
Brazil, were unchanged on the same period last year and
12% less than in 2019.
Despite widespread reports of supply shortages for
Indonesian bangkirai decking, imports of
moulding/decking from Indonesia were 34,400 tonnes
during the first six months of 2021, 26% more than the
same period in 2020 and 2% more than in 2019.
Imports of mouldings/decking from Peru were 7,600
tonnes, 71% more than in 2020 and 14% up on 2019.
Sawnwood imports from Gabon just exceeded 4,000
tonnes in the first 6 months this year, 30% more than the
same period in 2020 but down 1% compared to 2019.
Imports from Malaysia were 3800 tonnes in the first six
months this year, 1% less than in 2020 and 22% down
compared to 2019. (Chart 7).
Log imports
EU27 imports of tropical logs, which have been in long
term decline and are now a shadow of their former level,
did rebound 29% to 47,000 cu.m in the first six months of
this year.
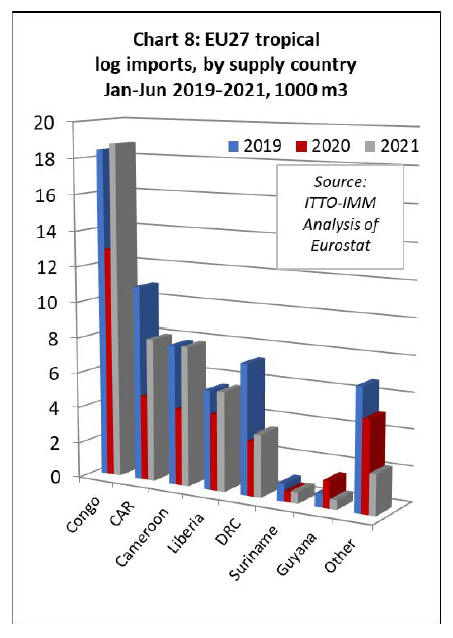
However, this is still 19% less than the same period in
2019. Imports in the first six months of 2021 from Congo
(18,800 cu.m), Cameroon (7,900 cu.m), and Liberia (5,600
cu.m) were all big increases on the same period in 2020
and close to the level of 2019 before the pandemic.
Imports in the first six months this year from CAR (8,000
cu.m) and DRC (3,500 cu.m), while significantly more
than the same period in 2020 were still well down on the
2019 level (Chart 8 above).
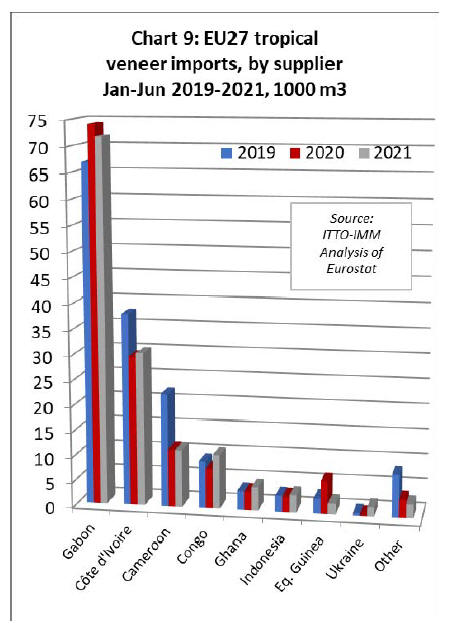
Slow EU27 imports of tropical veneer and plywood
EU27 imports of tropical veneer declined 1% to 138,900
cu.m in the first six months of this year. After a rapid rise
last year, veneer imports from Gabon declined 3% to
71,700 cu.m.
Imports were also down 1% to 11,400 cu.m from
Cameroon and 67% to 2,200 cu.m from Equatorial
Guinea. At 30,300 cu.m, veneer imports from Côte
d'Ivoire were 2% more than in 2020 but still down 20%
compared to 2019.
Larger gains were made in EU27 veneer imports from
Congo (+36% to 10,700 cu.m), Ghana (+27% to 4,700
cu.m), and Indonesia (+11% to 3,400 cu.m) (Chart 9).
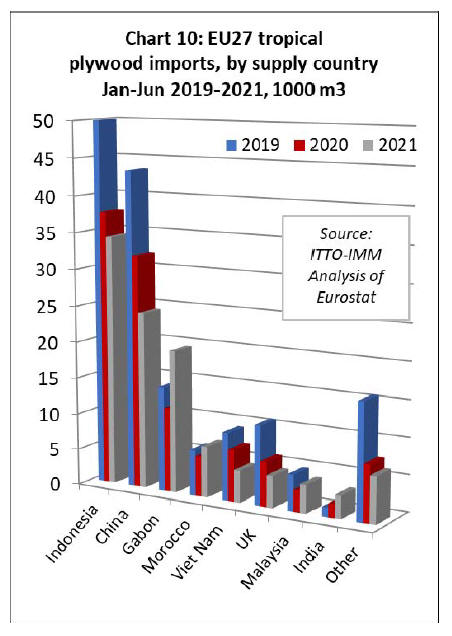
Overall the signs are that tropical hardwood plywood has
been a big loser in the competitive battle for dominance of
the EU plywood market, particularly against Russian birch
plywood. EU27 imports of tropical plywood were
107,000 cu.m in the first six months this year, that is 5%
less than the same period in 2020 and 31% down
compared to 2019.
Imports from Indonesia were 34,400 cu.m, 9% less than in
2020 and 31% less than in 2019. Imports of tropical
hardwood faced plywood from China were 24,000 cu.m,
24% less than in 2020 and 44% down compared to 2019.
EU27 imports of tropical hardwood plywood from
Vietnam and indirect imports from the UK also continued
to slide in the first half of this year.
More positively, imports of tropical hardwood plywood
from Gabon and Morocco made more inroads into the
EU27 market in the first half of this year.
Imports from Gabon were 19,500 cu.m in the first six
months, 69% more than the same period in 2020 and 36%
more than in 2019. Imports from Morocco were 7,000
cu.m, 27% more than in 2020 (Chart 10).
Rise in EU27 imports of tropical flooring from Malaysia
continues
EU27 imports of flooring from tropical countries were
11,300 tonnes in the first 6 months of 2021, 2% more than
in 2020 but still 7% down compared to 2019. The rise in
EU27 wood flooring imports from Malaysia, that began
last year, has continued into 2021.
Imports of 5,500 tonnes from Malaysia in the first six
months this year were 45% more than the same period in
2020 and 72% greater than in 2019.
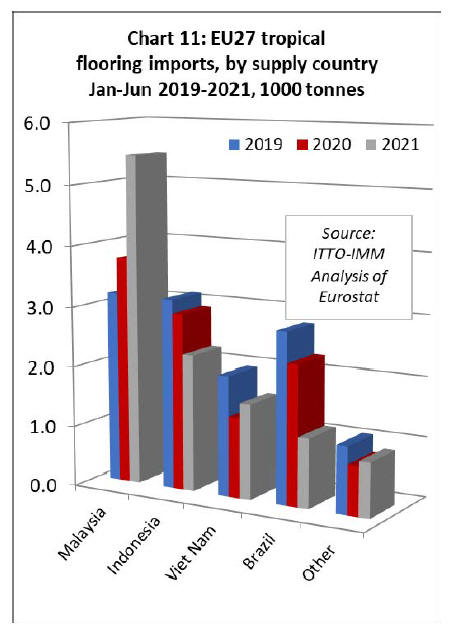
In contrast, flooring imports from Indonesia of only 2,300
tonnes were 23% less than in 2020 and 28% down
compared to 2019. Imports from Brazil have also
continued to slide, at just 1,150 tonnes in the first six
months, 50% less than in 2020 and 59% down on 2019
(Chart 11 above).
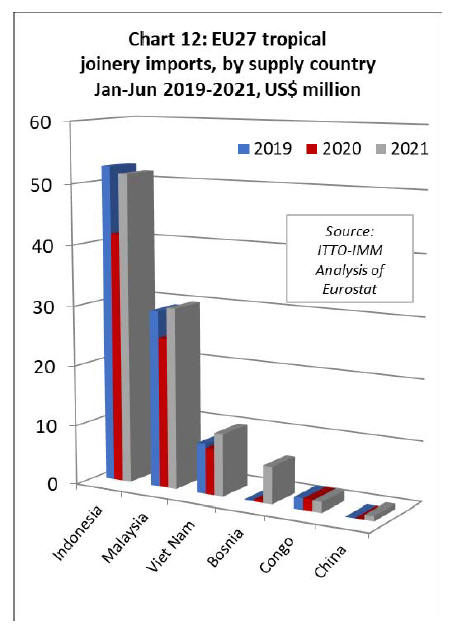
The value of EU27 imports of other joinery products from
tropical countries - which mainly comprise laminated
window scantlings, kitchen tops and wood doors -
increased 29% to US$104 million in the first six months of
this year.
Imports were up 24% to US$51.5 million from Indonesia,
up 21% to US$30.1 million from Malaysia, and up 36% to
US$10.4 million from Vietnam.
This year the EU27 has also begun to import joinery
products manufactured using tropical hardwood from
Bosnia. Import value from Bosnia was US$6.2 million in
the first six months of 2021 (Chart 12 above).
|