|
Report from
Europe
No strong COVID-19 signs in EU
tropical timber import
data
EU27 (i.e. excluding the UK) tropical timber product
imports continued to defy expectations of COVID-19
driven collapse in the four months to April this year.
Despite all the large western European countries
implementing COVID-19 lockdown measures starting in
the second two weeks of March, and mounting supply-side
problems in tropical countries, total imports of tropical
wood and wood furniture products into in the EU in April
were little changed compared to the previous month.
Unfortunately, this is not a good news story. The signs are
that the EU market for tropical wood products was
weakening well before the effects of COVID-19 were
even apparent.
The lack of evidence so far of a further downturn in direct
response to the COVID-19 outbreak is likely just a
reflection of the long lead times in the tropical wood
supply chain.
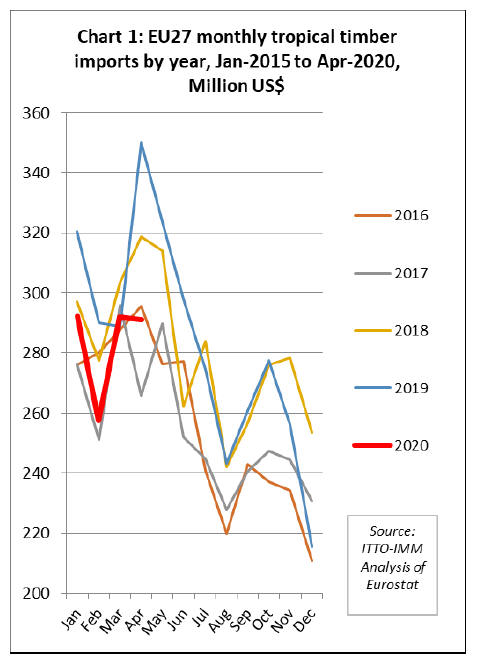
Chart 1, which shows the value of EU27 imports of
tropical wood and wood furniture products reported
monthly during the last five years, highlights that imports
in 2020 were closely mirroring imports in 2016 and 2017
to the end of April.
The tropical trade in the EU in both 2016 and 2017 was
weak overall and the signs were, before the onset of
COVID-19, that 2020 was lining up to be another slow
year. Certainly, well down on 2018 and 2019 when there
was a short-term revival in trade.
Given widespread reports during April of EU importers
struggling to deal with a build-up of stock that could not
be shifted as manufacturers, retailers and construction sites
went into lockdown, a more significant decline in imports
may well be seen in the May and June trade figures.
More positively, it should be said that the DIY sector in
the EU remained quite buoyant in some countries
throughout the lockdown months with many people taking
the opportunity to carry out home improvement work.
In other EU countries with less stringent lockdowns, such
as the Netherlands and Sweden, commercial construction
and some manufacturing activity also continued, at a
slower pace but without interruption.
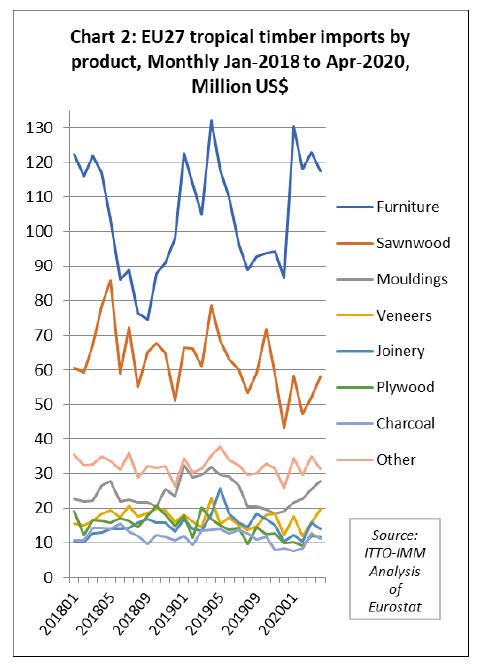
Chart 2 shows that in all tropical wood product groups,
there was no significant downturn in EU27 imports in
March and April this year. In fact, imports of some
product groups, such as sawnwood, mouldings/decking,
and veneer, increased during this period compared to the
previous two months.
EU imports from tropical countries are typically highly
volatile from month to month, and often show no
consistent pattern (Chart 3), making it difficult at this
stage to assess the likely longer-term effects of COVID-
19. However, the contrasting trends in monthly imports
from the two largest tropical suppliers to the EU -
Indonesia and Vietnam - provide some insights.
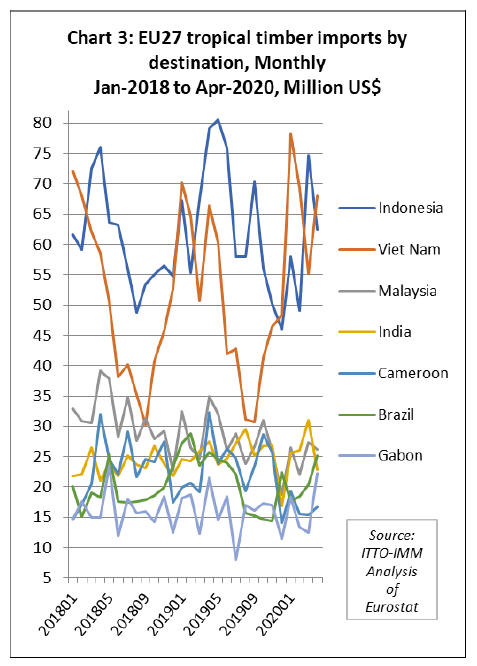
EU imports from Indonesia, which are dominated by
garden furniture, decking and plywood, tend to be
strongest in the spring season.
The sharp decline in imports from Indonesia in April this
year, at a time when trade is usually rising, does not bode
well for the rest of 2020.
In contrast to Indonesia, imports from Vietnam are
dominated by interior furniture and tend to be strongest at
the turn of the year, in time for the January sales, and to be
very slow during the summer and early autumn.
In that sense, Vietnamese suppliers have been more
fortunate because the lockdown in EU countries occurred
after a large proportion of shipments to the EU in a typical
year had already arrived. The import data also shows that
quite a lot of shipments from Vietnam continued to arrive
in the EU during April.
The full effects of COVID-19 on EU imports from
Vietnam will only become truly apparent later this year
when the products for next season begin (or fail) to arrive.
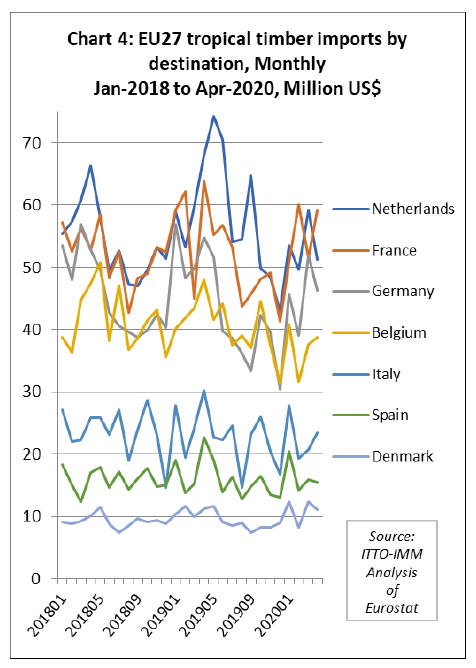
Chart 4 shows that there was no unprecedented downturn
in imports of tropical wood products into any EU27
country in the month of April this year. In fact, imports
were higher in Belgium, France and Italy in April than in
the previous month. There was a decline in Germany and
the Netherlands, but not inconsistent with previous
monthly changes.
EU economy forecast to contract 9% in 2020
It would be wrong to read too much into trade data that
only captures the first few weeks of the lockdown period
and does not account for the long lead times in the tropical
trade. Longer term indices of market health are less
reassuring.
The EUˇŻs ˇ®Summer 2020 Economic ForecastˇŻ, published 7
July, suggests that the EU economy will experience a deep
recession this year due to the coronavirus pandemic.
Because the lifting of lockdown measures is proceeding at
a more gradual pace than assumed in the Spring Forecast,
the impact on economic activity in 2020 is expected to be
more significant than anticipated.
The ˇ®Summer 2020 Economic ForecastˇŻ projects that the
euro area economy will contract by 8.7% in 2020 and
grow by 6.1% in 2021. The EU economy is forecast to
contract by 8.3% in 2020 and grow by 5.8% in 2021.
The Forecast notes that ˇ°the impact of the pandemic on
economic activity was already considerable in the first
quarter of 2020, even though most Member States only
began introducing lockdown measures in mid-March.
With a far longer period of disruption and lockdown
taking place in the second quarter of 2020, economic
output is expected to have contracted significantly more
than in the first quarterˇ±.
The risks to the Forecast are exceptionally high and
mainly to the downside. The Forecast assumes that
lockdown measures will continue to ease and there will
not be a ˇ®second wave' of infections. However, a second
wave is possible, particularly as the temperature cools in
the Autumn months.
There are also considerable risks that the labour market
could suffer more long-term scars than expected and that
liquidity difficulties could turn into solvency problems for
many companies. There are risks to the stability of
financial markets and a danger that Member States may
fail to sufficiently coordinate national policy responses.
The Forecast also notes that a ˇ°failure to secure an
agreement on the future trading relationship between the
UK and the EU could also result in lower growth,
particularly for the UK. More broadly, protectionist
policies and an excessive turning away from global
production chains could also negatively affect trade and
the global economyˇ±.
On the upside, the forecast notes that ˇ°early data for May
and June suggest that the worst may have passed. The
recovery is expected to gain traction in the second half of
the year, albeit remaining incomplete and uneven across
Member Statesˇ±. It suggests ˇ°a swifter-than-expected
rebound cannot be excluded, particularly if the early
availability of a vaccine or the epidemiological situation
improves generally to allow a faster lifting of remaining
restrictions than assumedˇ±.
EU tropical imports already down 9% before COVID-19
Trade data is also less reassuring about future market
prospects when cumulative EU imports in the first four
months of 2020 are compared to the same period in 2019.
Total EU import value of tropical wood and wood
furniture products was US$1.13 billion between January
and April this year, 9% less than in 2019.
This again highlights that, even before the effects of
COVID-19 are seen in the trade data, there was significant
cooling in the EU market for most tropical wood products
this year.
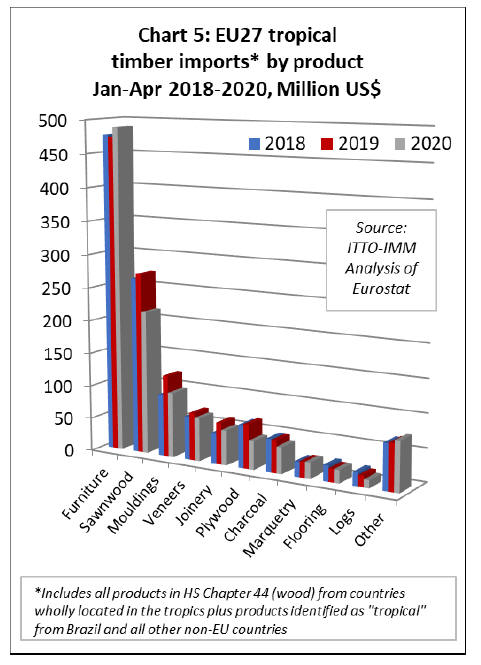
Although imports of wood furniture from tropical
countries increased 3% to US$488 million in the four
month period, imports of most other tropical commodities
declined sharply including sawnwood ( down 21% to
US$215 million), mouldings (down 20% to US$97
million), veneer (down 20% to US$65 million), joinery
(down 16% to US$52 million), plywood (down 36% to
US$43 million), charcoal (down 18% to US$24 million),
and logs (down 31% to US$12 million) (Chart 5).
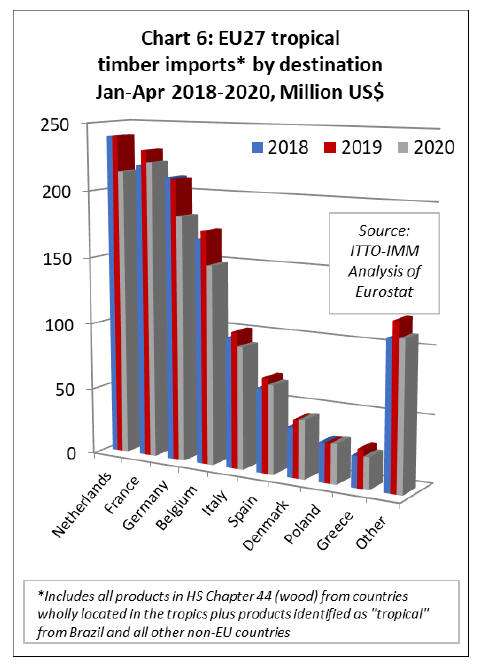
Imports fell into all six of the largest EU destinations for
tropical wood and wood furniture products in the first four
months of this year.
Imports were down 11% to US$214 million in the
Netherlands, 4% in France to US$222 million, 13% in
Germany to US$183 million, 14% in Belgium to US$149
million, 10% in Italy to US$91 million, and 6% in Spain to
US$66 million.
There was a slight gain of 2% in both Denmark, to US$44
million) and Poland, to US$30 million (Chart 6).
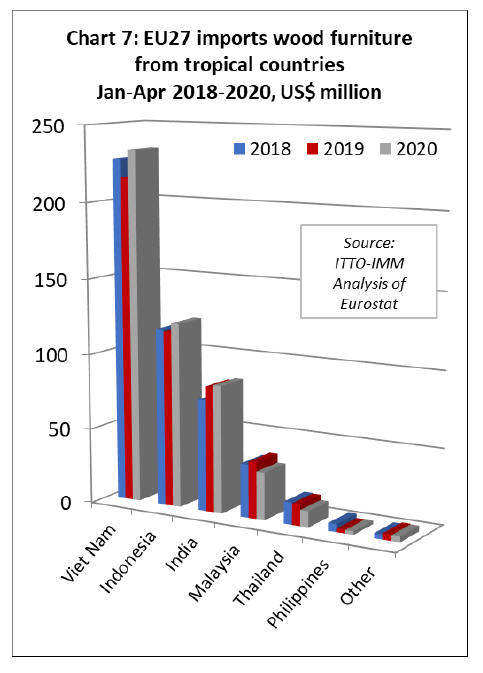
In the furniture sector, EU imports from all three of the
largest tropical supply countries were ahead this year
compared to last after the first four months. Imports were
up 8% from Vietnam at US$233 million, 5% from
Indonesia at US$122 million, and up 2% from India at
US$85 million.
This contrasted with declining imports from smaller
suppliers, including Malaysia, down 16% at US$31
million, Thailand down 24% at US$11 million, and the
Philippines, down 3% at US$2.3 million (Chart 7).
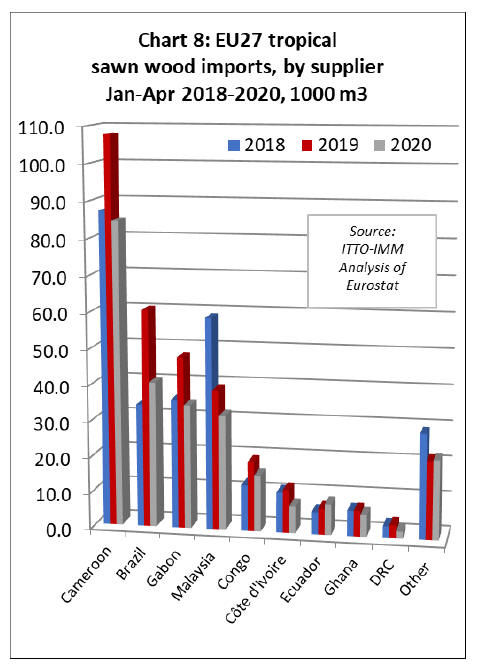
EU imports of tropical sawnwood declined sharply from
all major supply countries in the first four months of 2020;
down 22% from Cameroon to 84,500 cu.m, 33% from
Brazil to 40,500 cu.m, 28% from Gabon to 34,500 cu.m,
18% from Malaysia to 32,000 cu.m, 19% from Congo to
15,700 cu.m, 37% from Côte d'Ivoire to 7,600 cu.m, 16%
from Ghana to 6,100 cu.m, and 46% from DRC to 1,900
cu.m. Ecuador was the only country making gains this
year, rising 20% to 8,600 cu.m, likely driven by strong
demand for balsa for wind turbines (Chart 8).
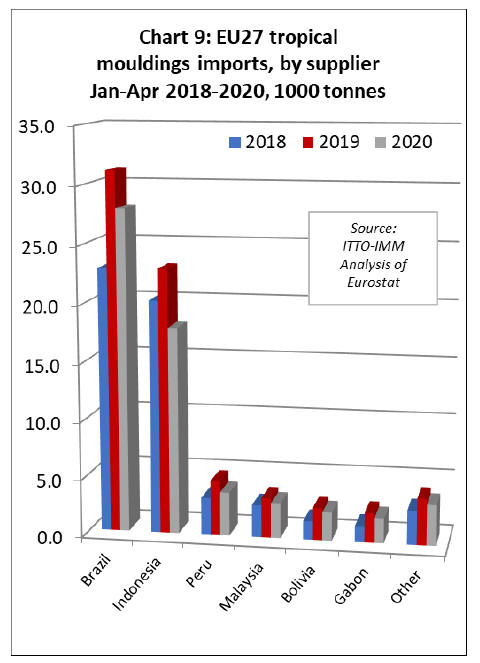
The decline in imports of tropical sawnwood in the first
four months of 2020 was mirrored by a similar decline in
imports of tropical mouldings/decking.
Imports of this commodity were down 10% from Brazil to
28,000 tonnes, 22% from Indonesia to 17,900 tonnes, 21%
from Peru to 3,800 tonnes, 12% from Malaysia to 3,000
tonnes, 12% from Bolivia to 2,500 tonnes, and 17% from
Gabon to 2,200 tonnes (Chart 9).
In the veneer sector, imports from Gabon bucked the
wider downward trend in EU imports in the first four
months of 2020. The EU imported 53,400 cu.m of veneer
from Gabon between January and April this year, 22%
more than the same period in 2019. Veneer imports also
doubled from a small base to 5,500 cu.m from Equatorial
Guinea.
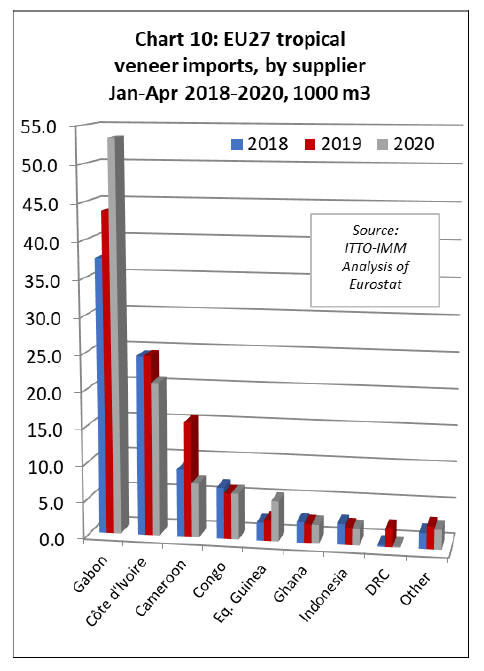
However, imports were down 15% from Côte d'Ivoire at
21,000 cu.m, 53% from Cameroon at 7,500 cu.m, and 7%
from Indonesia at 2,250 cu.m.
Imports were stable at 6,300 cu.mcu.m from Congo and
2,500 cu.m from Ghana (Chart 10 above).
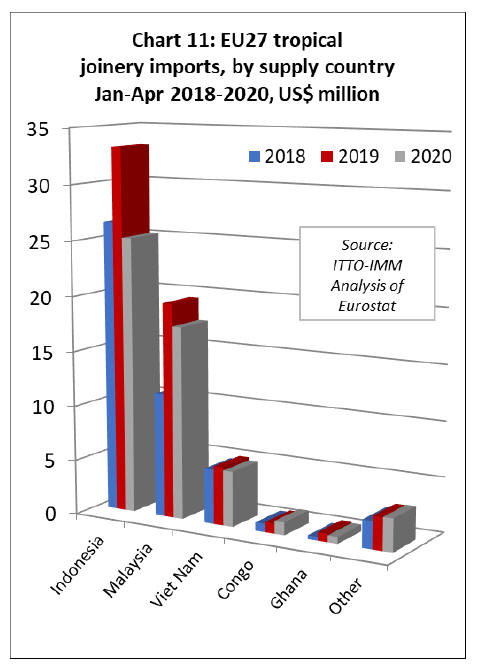
EU imports of joinery products from tropical countries,
which mainly comprise laminated window scantlings,
kitchen tops and wood doors, declined from all three of the
main supply countries in the first four months of 2020.
Imports from Indonesia were down 24% to 25,000 tonnes,
10% from Malaysia to 17,500 tonnes, and 5% from
Vietnam to 5,000 tonnes. There was a 30% increase from
Congo, to 1,160 tonnes (Chart 11).
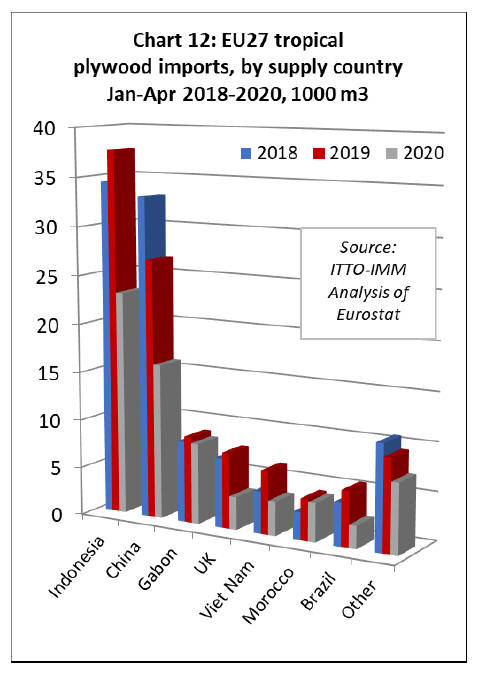
EU imports of tropical hardwood faced plywood were also
down from all the leading supply countries in the first four
months of 2020. Imports fell 39% to 23,100 cu.m from
Indonesia, 40% to 16,000 cu.m from China, 7% to 8,400
cu.m from Gabon, 7% to 4,000 cu.m from Morocco and
46% to 3,500 cu.m from Vietnam.
Imports of tropical hardwood faced plywood into the
EU27 from the UK, now also an external supplier to the
EU, declined 56% to 3,400 cu.m (Chart 12).
|