Japan
Wood Products Prices
Dollar Exchange Rates of 10th
September
2019
Japan Yen 107.82
Reports From Japan
Slowing business investment pulls
down growth
The Japanese economy expanded at a slower pace in the second quarter than
first reported as business investment was lower than expected. GDP expanded
at an annualised rate of 1.3% in the second quarter according to revised
data. The slow pace of growth was not a surprise as manufacturers had been
steadily reducing investment as the global economic outlook became bleaker.
Behind the slight rise in GDP was robust consumer spending.
In an odd twist, companies with a domestic market focus have been spending
more specifically on automation as they try and cope with the labour
shortage.
Private spending is expected to have risen in the third quarter and then
expected to shrink when the consumption tax is increased on 1 October. The
slowing growth has prompted calls for the Bank of Japan (BoJ) to expand its
stimulus package perhaps by lowering interest rates further into negative
territory.
BoJ Governor, Haruhiko Kuroda, is on record as saying cutting interest rates
further into negative territory is among the bank’s policy options because,
while Japan’s economy was sustaining momentum to achieve the BoJ’s 2%
inflation target, global economic risks were increasing.
Many analysts are expecting the BoJ to adopt further ease policies to
counter the recent yen strength which may become more of a problem if the
European Central Bank and the Federal Reserve introduce monetary easing
steps.
Business confidence flat-lines
Cabinet Office data on machinery orders showed an almost 7% decline in July
after positive figures were reported for June. Slowing global demand and the
drawn out trade tensions between the US and China derailed corporate
investment.
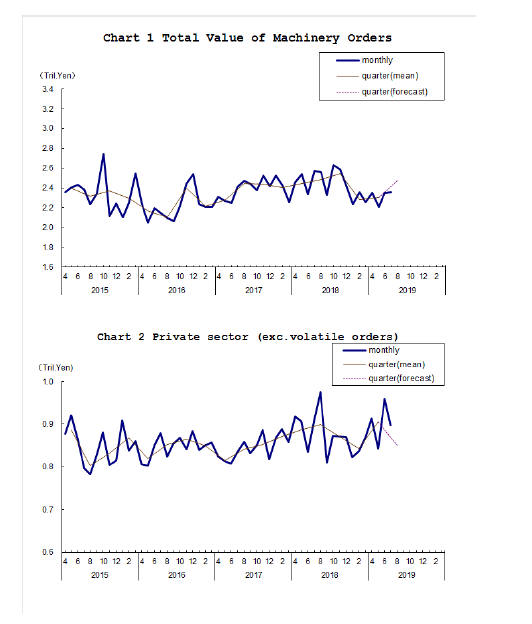
The government had been hoping on strength in
corporate spending to counter weak exports but this was wishful thinking and
the second quarter GDP growth was revised down. Economists were quick to
comment that it is unlikely that business spending could rise when exports
have declined.
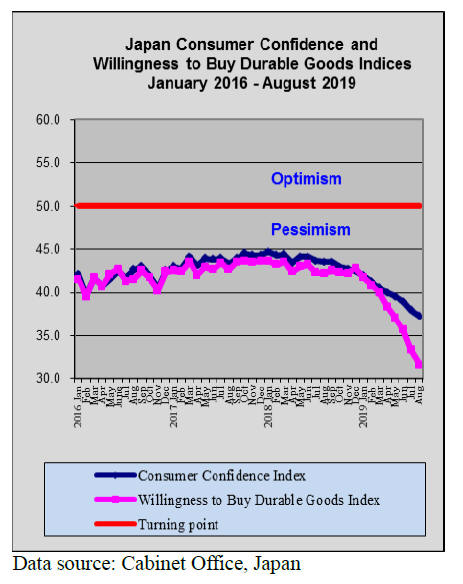
Business confidence in Japan dropped to the lowest level in more than 6
years in September according to a Reuters poll. This along with depressed
consumer confidence has slowed growth prospects giving rise to speculation
that the BoJ could act with more stimulus. The BoJ has to take account of
lower household spending and the risk that consumers could cut back further
as the tax increase comes into effect.
Against this back ground it is a surprise that the Cabinet Office maintained
its assessment of future machinery orders suggesting they are showing signs
of picking up.
BoJ signal it is more open to discussing
expanded stimulus
Bank of Japan (BoJ) Governor Haruhiko Kuroda said cutting interest
rates further into negative territory is among the bank’s policy options but
he stressed that if it were to ease, the BoJ must take into account the
impact such a move could have on Japan’s banking system and financial market
functions.
Markets are rife with speculation the BoJ could ease policy as early as this
month to fend off an unwelcome yen spike that could be caused by expected
monetary easing steps by the US Federal Reserve and the European Central
Bank.
The BoJ has signaled it is more open to discuss the possibility of expanding
stimulus and a decision will be made at their next meeting 18-19 September.
Shop with calculator in hand – multiple tax rates from October
When the new consumption tax rate becomes law on 1 October it will
mark the beginning of complications for households.
From October, food and beverages, excluding alcoholic drinks and eating out
at restaurants and daily necessities will continue to be taxed at the old
rate while the 10% rate will apply to a variety of goods and services.
To ease the financial burden on consumers a reward points system will be
introduced for nine months until June 2020, in which the government will
provide subsidies.
When consumers buy goods at small and medium sized stores with cashless
payments they will be given 5% of the purchase price in reward points.
For consumers the new scheme will initially involve multiple rates according
to the types of store and the items purchased. Retailers will really be
tested as they try to help consumers understand the application of the
different rates.
A local economist said, while the initial burden on of the tax increase on
consumers will be eased, he still anticipates a downturn and a cooling of
growth.
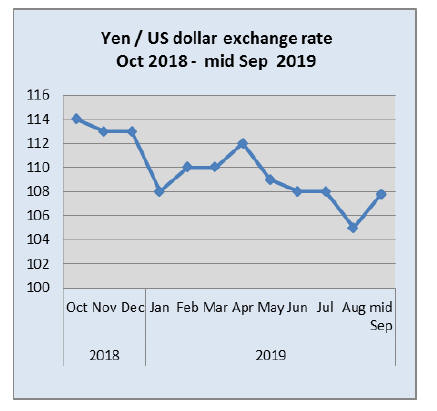
Rush to yen fades as US and China begin to
talk
The U.S. dollar gained ground against the yen in mid-September
because of general weakness in the so called ‘safe-haven’ such as the yen
because of a thawing of tensions between the United States and China. The US
dollar, at almost 108 yen, is at a 2 month high.
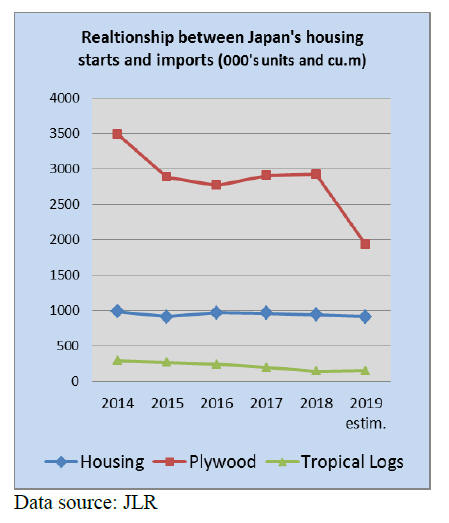
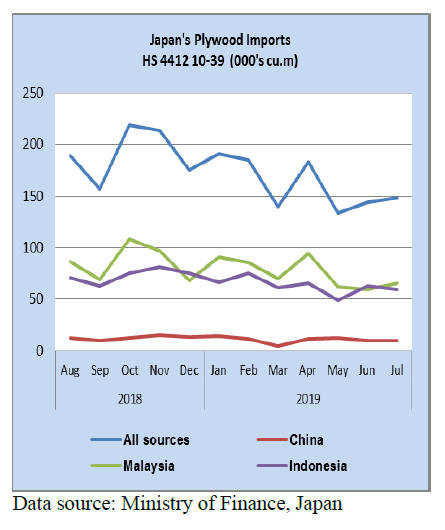
Link between housing starts and plywood
imports breaks
Annual housing starts in Japan have been within a narrow range over
the past 6 years and previously there was a close relationship between
housing starts and imports of plywood (mainly from Malaysia and Indonesia)
and with imports of tropical logs much of which was used to produce plywood.
The first signs of a break in the housing and import relationship came in
2015 when plywood imports dipped sharply. Another turning point was this
year when plywood imports plummeted despite steady housing stock growth.
Import update
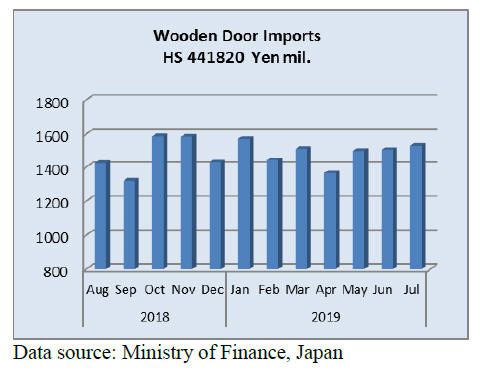
Wooden door imports
The value of Japan’s imports of wooden doors (HS441820) continued
to rise in July adding 7% to the value of June imports.
The top four shippers accounted for almost 90% of July imports with
manufacturers in China accounting for 60% of June imports followed by the
Philippines (21%). A further 5-6% was shipped from both Indonesia and
Malaysia.
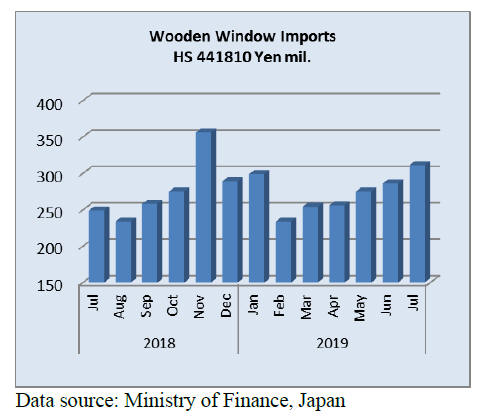
Wooden window imports
July marked the 5th consecutive increase in the value of Japan’s
wooden window imports. The value of July imports was up almost 25% year on
year and month on month July imports rose around 8.5%.
The top three in July were China (43% of imports) the US (27%) and there was
a further rise in imports of wooden windows from the Philippines which
contributed a further 21% to total July window imports.
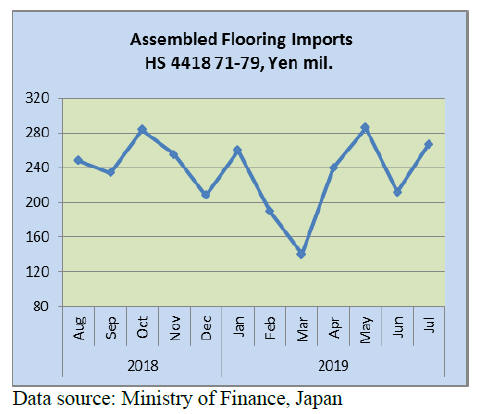
Assembled wooden flooring imports
In July there was a 12% year on year rise in the value of assembled
flooring imports and a 26% month on month increase. Assembled wooden
flooring imported into Japan falling within HS441875 accounted for most of
the July assembled wooden flooring imports with China shipping 61%,
Indonesia 10% and a further 10% from Thailand.
The second largest category of assembled wooden flooring imports in July was
HS441879 and the top shippers were Thailand (48%), Indonesia (25%) and China
(22%).
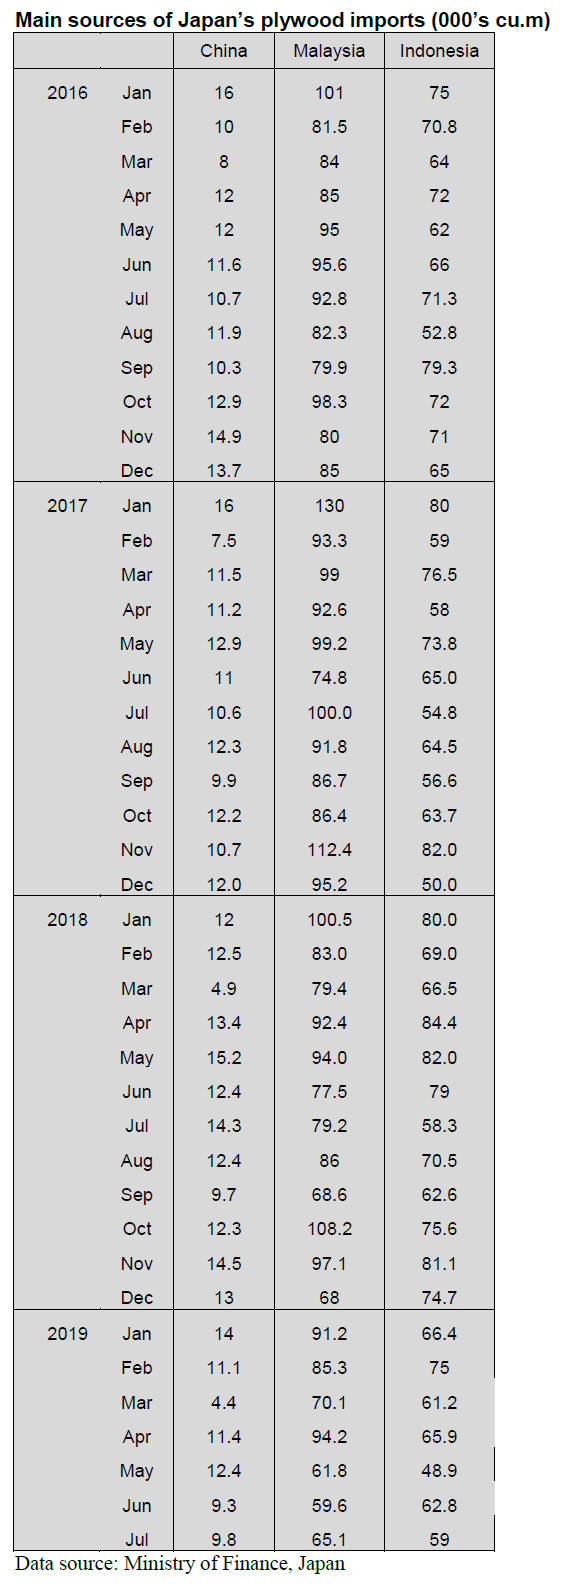
Plywood imports
One category of plywood, HS441875, dominated Japan’s plywood
imports and in July, as in the previous months, plywood in this category
accounted for well over 60% of all plywood imports.
Year on year the volume of July plywood imports from all sources fell 13%
and month on month import volumes were flat. The top three shippers remain
Malaysia, Indonesia and China.
In July shipments from China were down 5% year on year and there was an 18%
decline in arrivals from Malaysia. July shipments from Indonesia were almost
the same volume as in June.
Trade news from the Japan Lumber Reports
(JLR)
The Japan Lumber Reports (JLR), a subscription trade journal
published every two weeks in English, is generously allowing the ITTO
Tropical Timber Market Report to reproduce news on the Japanese market
precisely as it appears in the JLR.
For the JLR report please see:
https://translate.google.com/translate?hl=en&sl=ja&u=https://jfpj.jp/japan_lumber_reports/&prev=search
North American log and lumber imports for the first six months
Log import for the first six months was 1,332,321 cbms, 1.9% less
than the same period of last year. Lumber import was 839,675 cbms, 21.6%
less.
Logs from the U.S.A. are 857,809 cbms, 4.1% less and from Canada are 474,512
cbms, 2.2% more. Total Douglas fir logs decreased to 1,201,791 cbms, 3.8%
less. Export prices of Douglas fir logs from the U.S.A. dropped down to
normal level from high prices in 2018 but the volume didn’t increase.
Meantime, Canadian Douglas fir prices stayed up high but demand by plywood
mills in Japan was strong and the supply increased so that arrivals
increased. A major supplier in Canada stopped the supply for a month in
August but with ample inventory, the supply for the second half seems to be
enough but high export log prices may reduce the demand so the volume in the
second half may be down.
Hemlock, spruce and yellow cedar log supply increased but this depends on
rotation of Alaskan log shipment and there is no change in demand except for
hemlock to which Tanimoto Lumber in Hiroshima quit cutting hemlock logs so
future demand of hemlock logs would decline.
In lumber import, all of three major species of SPF, Douglas fir and hemlock
decreased. SPF lumber import dropped in the first half by drop of export
prices and declining demand of rental units.
The demand recovered in the third quarter and the export prices bottomed out
but by depressed North American lumber market, many sawmills either reduce
the production or shutdown so the supply would stay tight despite more
purchase orders.
Douglas fir lumber supply declined some but hemlock supply markedly
declined. Demand for hemlock decreased by unstable supply. The market
slackened by oversupply so that major supplier in Canada shutdown the mill
for a month in March and April to reduce the supply then the same mill went
onto to the strike in July so fall supply is shaky but present inventory in
Japan is satisfactory.
Domestic log supply for the first half
Domestic logs supply for lumber manufacturing in the first six
months of the year was 6,718,000 cbms, 6.2% more than the same period of
last year and this is the most increase in last five years.
Logs for plywood manufacturing were 2,282,000 cbms, 9.1% more.
Domestic log supply has been increasing since 2010 but this year’s volume is
particularly large as log supply for lumber manufacturing was about
6,300,000 cbms during 2014 and 2018. The reason is favorable weather during
January and April this year with very little snow and warmer temperature.
In last several years, record snow fall was registered in many areas. Also
rather high log prices since fall of 2016 stimulated active harvest.
Log prices depressed from 2015 to fall of 2016 and marked the record low
prices, which discouraged log harvest then the market recovered since fall
of 2016 and the log prices did not drop down to record low of 2015. In
particular, cypress log prices stayed up high for two years. Sawmills like
winter harvested logs so mills’ log inventory was satisfied amply and there
was no log supply shortage during summer months this year. August is the
month when log supply drops every year.
By declining log supply, post cutting cedar log prices firmed up since late
July and cypress log prices are rebounding everywhere so log market seems to
stay firm for coming months. However, lumber market is shaky and cedar
lumber prices are weakening. Sawmills are caught in between high log prices
and softening lumber prices.
Plywood supply for the first six months
Total supply of plywood for the first half of this year is
2,916,200 cbms, 5.6% less than the same period of last year.
Domestic plywood supply is 1,618,100 cbms, 1.1% more while imported supply
is 1,298,000 cbms, 12.7% less.
Shipment of domestic plywood exceeded the production but market of imported
plywood continued stagnant with dull shipment.
Monthly volume of imported plywood continued low. January volume was over
250,000 cbms then it was less than 200,000 cbms in May and June. The volume
from Malaysia was 475,200 cbms, 12.3% less and Indonesia was 432,700 cbms,
14.9% less. Volume from China was 297,500 cbms, 9.1% less and others are
92,500 cbms, 15.6% less. Sluggish market in Japan and high export prices
make future purchase difficult.
Shipment of domestic plywood is 1,643,800 cbms, 5.7% more out of which
softwood plywood is 1,572,300 cbms, 6.0% more. Structural softwood plywood
is 1,447,000 cbms, 4.8% more. Production of softwood plywood in June
recorded the highest of 276,300 cbms and the shipment was 270,200 cbms so
June end inventory was 141,200 cbms, only 8,600 cbms increase since last
January.
Movement of domestic softwood plywood has been very active. Precutting
plants placed orders as August had longer holidays than normal years and
thick panel deliveries are delayed as securing trucks is becoming difficult
chronically now.
All the plywood mills are running to the full but delivery delay occurs.
July production and shipment were record high and the inventory is dropping.
Long panel producing lines broke down in plywood mill in Western Japan so
supply of long length panel is getting tight. Other mills try to cover this
but producing long length panels mean reduced production of standard 12 mm
3x6 panel so it is not easy to make long panel now.
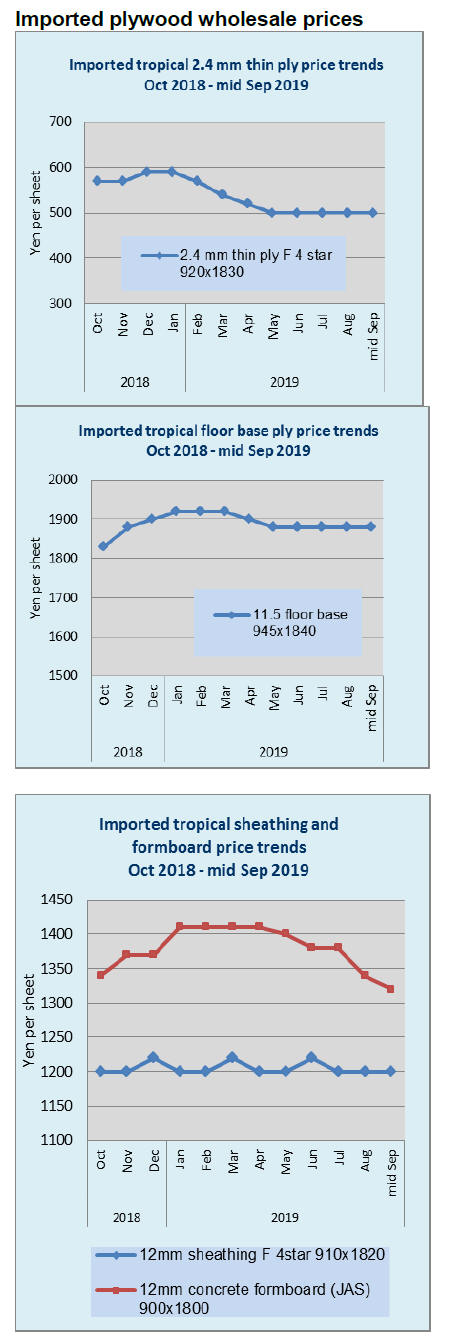
Imported plywood volume has been less than 200,000 cbms a month for three
straight months but the movement in Japan continues dull and slow. The
importers are unable to place orders for future cargoes because of high
export prices and sluggish Japan market.
Among inventories of imported plywood, there are some short items and a
balance is off by items. Port inventories are not high but the market does
not feel any shortage feeling. Recent strong yen makes future cost down so
the market prices are further weakening.
Domestic log export for the first six months
Volume of exported domestic logs and lumber in the first half of
the year was 617,089 cbms of logs, 9.0% more than 2018 and 73,647 cbms of
lumber, 7.3% more. Cedar is leading species and cypress is declining.
Rapidly increased cedar lumber export to the U.S.A. was 11,934 cbms, 8.8%
more so rate of growing is slowing but it is becoming steady business. Log
export to Korea is decreasing but lumber export is increasing.
China, the largest log buyer, imported 520,100 cbms, 12.9% more. If China
keeps buying with this pace, total year volume may reach one million cbms.
Cedar lumber export to China is over 10,000 cbms so China is as large as
U.S.A. as cedar lumber buyer.
For Korea, volume of cedar logs is almost the same as 2018 but cypress logs
decreased. It is possible that China buys Japanese cypress logs and
processes to lumber then exports to Korea, which is why cypress volume for
Korea declined.
Cypress lumber for Korea from Japan also increased so it is competition
between China and Japan in Korean market. For Taiwan, cypress log export
decreased by half then lumber export of cypress increased almost double so
it is shifting from logs to lumber.
Value of export of logs was 8,394 million yen, 12.7% more and lumber was
2,983 million yen, 0.4% more. Compared to increase of lumber volume, the
value did not increase as much as volume, which means drop of unit prices.
Cedar lumber prices for China was 17,660 yen per cbm in 2018 then it is
13,063 yen in 2019. Cedar log prices for China was 12,058 yen in 2018 then
it increased to 12,718 yen In 2019, export log volume may increase but the
value may not increase as much as the volume.
In Kyushu, where is the main log exporting region, cedar log prices for
export is reported weakening.
|