|
Report from
Europe
Slow growth in EU wood furniture production in
2018
The value of EU wood furniture production was €41.4
billion in 2018, only 0.8% more than the previous year.
This continues the trend of slow, but consistent, annual
growth of around 1% in the last 5 years. Despite this
growth, the total value of wood furniture production in the
EU in 2018 was still 20% down, in real terms adjusted for
inflation, compared to the years just prior to the financial
crises in 2008
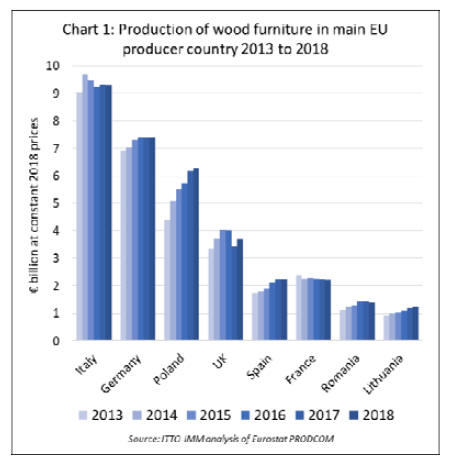
Last year, slowing wood furniture production in France,
Romania, and Sweden offset gains made in Poland, the
UK, Lithuania and the Netherlands. Production in Italy
and Germany, the two largest wood furniture
manufacturing countries in the EU, was flat in 2018 (Chart
1).
Despite only slow production growth, EU manufacturers
are maintaining their hugely dominant position in the EU
wood furniture market.
In 2018, 87.0% of all wood furniture sales in the EU
market comprised products manufactured within the EU, a
marginally higher percentage than in the previous year
(86.8%).
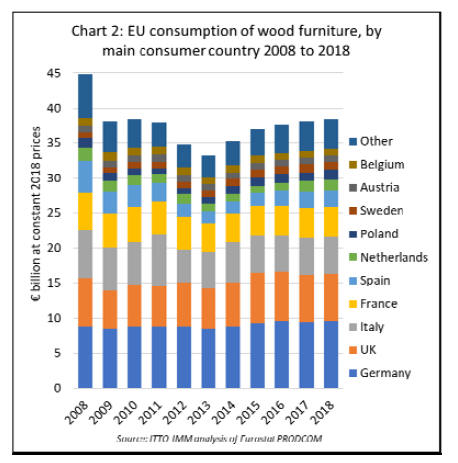
EU wood furniture consumption was €38.5 billion in
2018, a gain of 1.2% compared to 2017. During 2018,
consumption increased by around 1% each in Germany (to
€9.6 billion), the UK (to €6.7 billion), and France (to €4.4
billion). Consumption growth was stronger in Spain (+2%
to €2.3 billion), the Netherlands (+3% to €1.6 billion), and
Poland (+4% to €1.4 billion).
However, consumption fell 4% to €1.1 billion in Sweden
and consumption in Italy was flat at €5.3 billion in 2018
(Chart 2).
Slowing pace of EU wood furniture imports
The generally slow development of the EU wood furniture
market in 2018 is also apparent in the import data. After
rising 7% in 2017, the value of EU imports of wood
furniture from non-EU countries fell 1% to €6.21 billion in
2018.
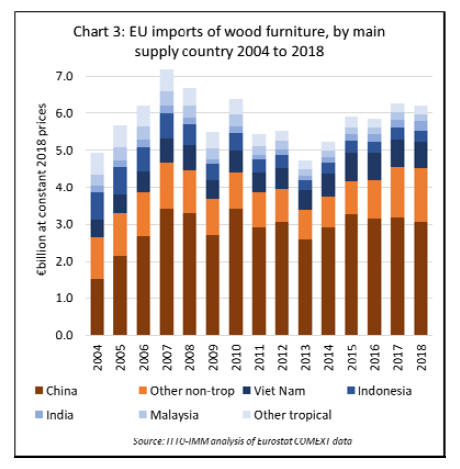
Imports from China, by far the largest external supplier,
fell 4% to €3.1 billion in 2018 and imports from tropical
countries fell 0.5% to €1.69 billion. However, there was a
7% rise in import value from non-EU temperate countries,
to €1.46 billion, notably Ukraine, Belarus and Turkey
(Chart 3).
While the total value of EU wood furniture imports fell in
2018, import tonnage increased indicating a decline in the
price and/or a change in the mix of products. Total import
tonnage increased 5% in 2018, to 2.26 million metric
tonnes (MT).
Import tonnage increased by 1% from China to 1.12
million MT, and by 4% from tropical countries to 609,000
MT. However, continuing the trend of recent years, there
was a sharper increase in imports from countries bordering
the EU, including Ukraine (+30% to 97,000 MT), Belarus
(+22% to 85,000 MT) and Turkey (+16% to 82,000 MT)
(Chart 4).
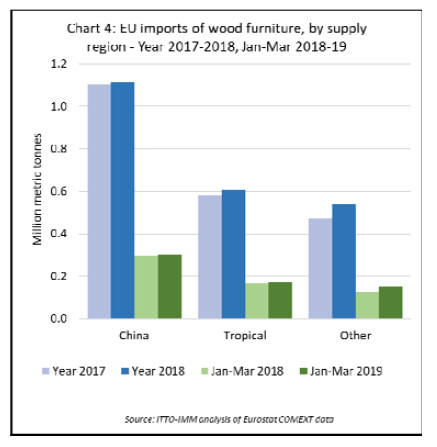
These broad trends have continued in 2019. In the first
quarter of this year compared to the same period in 2018,
EU wood furniture imports from tropical countries
increased by only 1% to 171,000 MT and imports from
China were up 2% to 302,000 MT.
Meanwhile, imports from non-EU temperate countries
increased 16% to 148,000 MT, with imports rising 35%,
23% and 16% respectively from Ukraine, Belarus and
Turkey.
While China remains the largest external supplier of wood
furniture to the EU, the overall decline in EU imports from
China between 2015 and 2018 is notable. In recent years
China’s competitiveness in the EU wood furniture market
has been impeded as prices have risen on the back of
growing domestic demand and new laws for pollution
control pollution in China.
EU furniture importers also continue to question the
variable quality of product imported from China and some
have struggled to obtain the legality assurances required
for EUTR conformance when dealing with complex wood
supply chains in China.
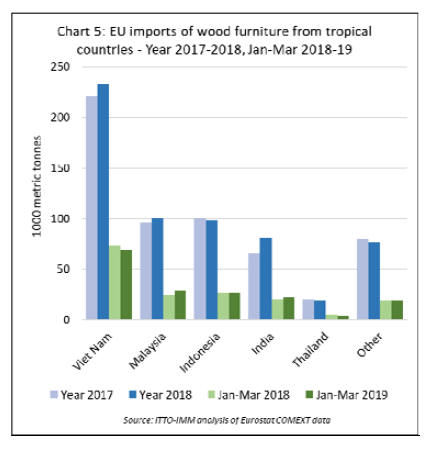
Of tropical countries, Vietnam is the leading supplier of
wood furniture to the EU. EU imports from Vietnam
increased 6% to 233,000 MT in 2018, but were slow in the
first quarter of 2019, falling back 6% compared to the
same period last year, to 70,000 MT.
The trends are different in euro value terms. EU import
value from Vietnam was flat in 2018, at €723 million, but
increased 2% to €230 million in the first quarter of 2019.
In the EU, the Vietnamese furniture sector has gained a
reputation for supply of large volume mid-range products,
both for exteriors and, increasingly, for interior use.
Market research by the FLEGT Independent Market
Monitor, hosted by ITTO with EC funding, indicates that
the Vietnamese furniture industry is regarded by EU
importers as technically more evolved than most other
Asian producer countries and increasingly able to supply
products to high European quality standards.
EU imports of wood furniture from Indonesia declined 3%
in tonnage terms to 99,000 MT in 2018 but increased 2%
to 27,000 MT in the first quarter of 2019 compared to the
same period last year. In value terms, imports from
Indonesia declined 2% to €301 million in 2018 and
increased 7% to €89 million in the first quarter of 2019.
The relative lack of growth in EU furniture imports from
Indonesia since the start of FLEGT licensing in November
2016 may seem disappointing, but the trend is influenced
by wider stagnation in EU furniture market growth and by
intense competition in the sectors targeted by Indonesian
manufacturers.
Indonesia’s furniture exports to the EU are dominated by
outdoor products, particularly due to relatively abundant
plantation teak supplies.
However, there is now intense competition in this sector
from a wide range of modified temperate wood and nonwood
products which are taking share from tropical
hardwoods.
Indonesia's long woodworking tradition has also meant it
has gained a reputation for supply of good quality
specialist hand-made furniture, a niche market in the EU
where it competes most directly with India.
In 2018, EU imports of wood furniture from India
increased 21% to 81,000 MT, and the rising trend
continued in the first quarter of 2019 with a further
increase of 10% to 23,000 MT. In value terms, EU imports
from India increased 18% to €238 million in 2018, and by
15% to €66 million in the first quarter of 2019.
Imports of wood furniture from Malaysia increased 5% to
101,000 MT in 2018 and by a further 20% to 29,000 MT
in the first quarter of 2019. In value terms the trend was
slightly different, with imports from Malaysia falling 1%
to €197 million in 2018 but recovering 19% to €57 million
in the first quarter of this year.
Malaysia is supplying the EU market with high quality
furniture products but a much smaller range than Vietnam
with a heavy focus on rubberwood and other plantation
species.
Changing direction of investment flows in global
furniture industry
Insights into the current furniture market in the EU, set
within wider global market trends, were provided at the
CSIL World Furniture Outlook seminar which took place
on April 10th 2019 at the Salone del Mobile show in
Milan.
According to CSIL, drawing on data presented at the
seminar (www.worldfumitureonline.com), the overall
trend in global furniture consumption is positive with
growth expected to continue at an annual rate of 3% (in
real terms) in the coming years. As in previous years, the
fastest growth rate is expected to be in Asia but positive
trends are also expected in all the other main consuming
regions.
While growth is being maintained overall, discussions at
the seminar also highlighted that the recent globalisation
trend, which has been so much a feature of the industry
and contributed to the rapid expansion of furniture
production in parts of Asia in recent years, may be
slowing.
According to CSIL’s report of the seminar “this was due
to several concurrent factors….including the continuous
reduction in the gap between Chinese and US/European
production costs, the reduction of labor intensity due to
the progressive advent of technology, the development of
regional value chains and productive systems integration
and finally the increasing demand for product
customization and shorter time to market, which are
favoring proximity of the industry to its clients”.
CSIL also mentioned the present “chaotic status of
international trade regulations” as another factor creating
uncertainties in the international investment environment
for furniture and which may be encouraging a greater
focus on intra-regional rather than globalised trade.
According to CSIL data presented to the seminar, despite
relatively slow production growth, Europe is still a leading
player in the global furniture industry, being the second
largest producing region in the world and accounting for
around one quarter of the total sector output.
The seminar highlighted some of the steps being taken by
European furniture manufacturers to maintain their
existing dominance in the European regional market and
to expand their influence in export markets.
A presentation by Giulia Taveggia, CSIL partner, drawing
on a new CSIL report on the market position of the
world’s top 200 furniture manufacturers, highlighted the
extent to which overseas investment has become of
strategic importance in the sector. Around half of these
large manufacturers now operate manufacturing plants
outside their headquarter country.
For European companies, the history of foreign investment
is a long one. The early focus of outside investment was in
neighbouring European countries, particularly those
acceded to the EU from 2004 onwards, most notably
Poland, but extending into a wide range of countries
including Romania, Lithuania, and the Czech Republic.
More recent investments have been directed towards non-
EU countries, mainly in the European region (such as
Ukraine and Belarus) but also further afield, notably in
China.
The CSIL report also highlighted growing investment
flows in the opposite direction as Chinese companies are
increasingly engaged in “branding/know-how”
acquisitions and other agreements or mergers with leading
European furniture manufacturers.
This reflects a strategic decision by some Chinese
companies to invest closer to major western consumer
markets and to add high-end and mid-high-end brands to
their product portfolio.
A presentation by Piotr Beer and Sylwia Oleriska of the
Polish Chamber of Commerce of Furniture Manufacturers
(OIGPM) focused on the efforts of Polish manufacturers
to enhance their competitiveness in the global furniture
market.
To achieve this, Polish manufacturers are building on their
long experience of trading furniture in the highly
competitive Western European market, on their relatively
lower production costs and the high quality of furniture
supplied.
Beer and Oleriska suggested that the main challenges to
Polish manufacturers competitiveness relate to the
implementation of new technology for furniture
manufacturing, the need to reinforce brands, and for
greater cooperation with designers to increase the added
value of production.
To overcome these challenges, the Polish furniture sector
is focusing very heavily on development of human
resources, through training and with specific initiatives to
reduce entry barriers and increase sector attractiveness for
younger workers.
CSIL report, Africa a growth market for furniture
Several African countries have good potential to develop
their furniture industry, both for expanding internal
consumption and for export markets. Total furniture
consumption in Africa is expected to rise 2.4% in real
terms during 2020 and significant consumption growth is
expected longer term.
These are key conclusions of the latest edition of the
Africa Furniture Outlook report by CSIL, the furniture
research organisation based in Milan, Italy (available for
online purchase and download at:
www.worldfumitureonline.com)
According to CSIL, Africa has a total household
consumption of US$1,400 billion with 1.13 billion
inhabitants and per capita GNP of about US$ 1,700.
Consumer demand has grown rapidly in the last decade
thanks to an increase of the real income.
With 16% of the world's total population, Africa accounts
for only 3% of world GDP but, according to IMF
projections, per capita GDP between 2019 and 2023 will
grow faster in Africa than in all other world regions except
Asia.
CSIL estimated that apparent furniture consumption in
Africa (at production or import prices, excluding retail
mark-up) was US$9.8 billion in 2017, which is $8 per
capita and represents just 2% of total global furniture
consumption.
The main furniture consumer markets in Africa, all with
consumption exceeding US$500 million in 2017, are
South Africa, Nigeria, Algeria, Egypt, Morocco and
Sudan. North Africa, West Africa and South Africa are the
main consuming regions, showing the highest per capita
furniture consumption. CSIL note that Africa has 59
metropolitan areas with population in excess of 1 million.
Despite political instability and relatively poor infrastructure,
these urban centres are expanding, with
diversifying economies, and have significant potential as
growth markets for furniture. In some areas, large
investments are being made in real estate and tourism
while the hospitality, cultural and entertainment sectors
are all boosting demand for furniture.
CSIL report that total furniture imports in Africa
(including both internal African trade and imports from
outside the region) were worth about US$3 billion in
2017. About 32% of furniture consumed in Africa is
imported from outside the region and 68% is
manufactured internally.
About 45% of imports from outside the region come from
China, followed at a distance by Italy and Turkey.
Most imports from outside the region are destined for
Southern and Northern Africa. South Africa is the largest
furniture importer in the Southern region, importing
mainly from China, Germany, and Italy. In North Africa
the largest furniture importer is Morocco (which imports
mostly from China, Spain, France and Italy), followed by
Algeria, Egypt and Libya.
In 2017, total Africa furniture production was US$ 7.5
billion in 2017, and only 10% of furniture manufactured in
Africa was exported, the main exporting countries being
Egypt, South Africa, Morocco and Tunisia.
|