|
Report from
Europe
EU wood furniture manufacturers reassert home
market dominance
The latest Eurostat trade data shows that the EU’s wood
furniture industry, having lost a little ground to imports in
2017, is struggling to increase sales outside the EU as
global trade slows. However, the sector is once again
reinforcing its dominance in the home market this year.
As reported by ITTO MIS in July (Volume 22, Number
13), the EU wood furniture sector recorded only slow
growth in 2017. The value of EU wood furniture
production was €40.3 billion in 2017, no change from the
previous year. Total imports from outside the region
increased 9% to €6.29 billion.
In 2017, EU wood furniture imports increased 7% from
the tropics, to €1.75 billion, and 3% from China, to €3.18
billion. However, most of the gains were made by other
non-EU temperate countries, such as Ukraine, Bosnia and
Serbia. Total imports from these countries increased 28%
to €1.36 billion.
EU consumption of wood furniture was €37.6 billion in
2017, a gain of 2% compared to 2016. Despite the rise in
imports in 2017 the share of domestic manufacturers in
total EU furniture supply declined only slightly last year.
In 2017, domestic manufacturers accounted for 86.7% of
the total value of wood furniture supplied into the EU
market, down from 87.5% in 2016.
EU wood furniture production data is published only
annually, so it is too early to assess how consumption is
developing in 2018. However, EU monthly data on
internal and external trade provides insights into the
changing share of the various wood furniture supply
countries to the EU, alongside changes in internal
distribution patterns in 2018 which may have long term
implications.
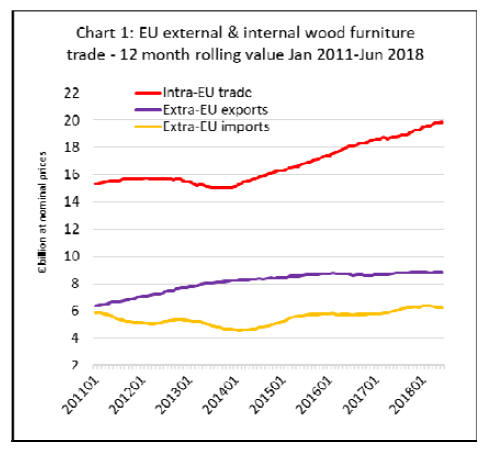
Eurostat trade data reveals that internal EU trade in wood
furniture, which increased 4% to €19.2 billion in 2017,
increased a further 6% in the first half of 2018.
Meanwhile the pace of EU wood furniture exports to non-
EU countries, which were flat at €8.7 billion in 2016 and
2017, have continued at the same rate in the first half of
2018. Wood furniture imports into the EU from outside
the region were rising in the second half of 2017, but
began to dip in the first half of this year (Chart 1).
Poland’s increasing role in EU wood furniture supply
Closer analysis of EU internal trade flows suggests that the
Polish wood furniture industry, which is expanding partly
at the expense of manufacturing in western European
countries, particularly Germany, is playing an important
role to drive the on-going rise in internal EU trade. By far
the largest increase in internal EU wood furniture trade
flows in the last two years was in exports from Poland to
Germany (Chart 2).
In recent years, Poland has quickly emerged as the world’s
sixth largest furniture producer and fourth largest furniture
exporter.
This has been achieved by exploiting the combination of
the EU’s common market in goods, proximity to Germany
and other large western European markets, and low labour
costs. Hourly labour rates average only around €9 in
Poland compared to €27 for the EU as a whole and €34 in
Germany.
Germany is Poland’s largest furniture export market with a
share of around 30% of total trade, followed by UK,
Czech Republic, France and the Netherlands.
In the wood furniture sector, Poland has benefitted from
the relatively large forest resource in Eastern Europe,
although availability of oak, by far the most popular
species, has been a limiting factor in recent years.
Another limiting factor is that Polish brands are not yet
well known in export markets and overseas sales are
largely controlled by large retail chains that dominate
fashion and design trends.
At present, there are over 27,000 Polish companies
involved in furniture manufacturing, although only 407
large and medium-sized enterprises account for three
quarters of production. Poland is the second largest
supplier of furniture to Ikea after China. The Swedish
giant operates a dozen factories in the country and is the
largest company in the furniture industry in Poland.
Nevertheless, the Polish furniture industry is also
characterised by many companies with domestic capital
which are becoming leading players in the Central and
Eastern European market. Efforts are also being made by
these companies to increase production and sales of ownbrand
product.
Rising importance of Netherlands in EU-wide furniture
distribution
In addition to the rising influence of Poland in EU wood
furniture supply, Chart 2 indicates that there has been
significant growth in wood furniture exports by
Netherlands to neighbouring EU countries since 2016.
Wood furniture supply in the Netherlands is fed by
imports from outside the EU, and by domestic wood
furniture manufacturing, both of which have been rising in
the last 2 years.
This suggests that the Netherlands in playing an increasing
role in the wood furniture sector, as in other wood sectors,
in the distribution of products to other EU countries. It is
likely driven by two factors.
First moves to consolidate the retail sector in the EU
which has been accompanied, to some extent, by greater
centralisation of retailers’ procurement operations. This
has led to greater focus on imports through the large ports
in Benelux countries.
Second, the EU Timber Regulation (EUTR) may be
reinforcing this trend towards concentration of the
procurement function.
Smaller importers have become more inclined to buy from
other larger EU importers, or only from EU-based
manufacturers, to avoid the requirement to implement due
diligence systems.
If this latter factor is important, then it should present an
opportunity for Indonesian products which, due to FLEGT
licensing, are the only non-EU wood furniture products
that may be placed on the EU market without any further
due diligence.
However, so far other factors are not leading to a
significant increase in Indonesian wood furniture trade
with the EU – such as very long lead times in supply from
Indonesia and the country’s tight focus on marketing of
only a relatively limited range of mainly exterior, often
teak, products in the EU, without regularly reviewing the
products to ensure they align with changing fashion trends.
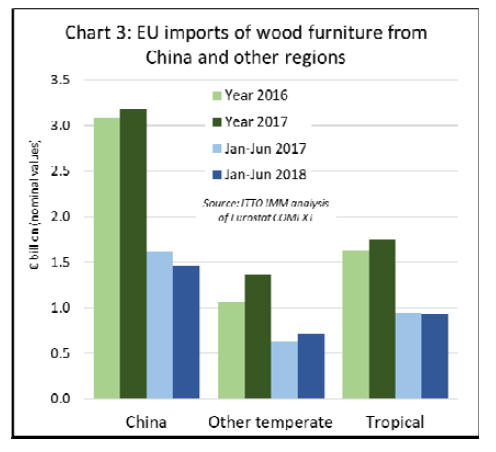
Fall in EU wood furniture imports from China and the
tropics in 2018
After making gains last year, EU wood furniture imports
from tropical countries and China fell in the first 6 months
of 2018. EU imports from tropical countries decreased 2%
to €940 million, while imports from China fell nearly 10%
to €1.46 billion (Chart 3).
In recent years China’s competitiveness in the EU wood
furniture market has been impeded as prices have risen on
the back of growing domestic demand and new laws for
pollution control pollution in China. EU furniture
importers also continue to question the variable quality of
product imported from China and some have struggled to
obtain the legality assurances required for EUTR
conformance when dealing with complex wood supply
chains in China.
Meanwhile EU imports of wood furniture have continued
to rise from other temperate countries, mainly bordering
the EU. EU imports from these countries increased 14% to
€720 million in the first 6 months of 2018, building on a
28% gain recorded the previous year. The biggest gains
are being made by Ukraine, Bosnia and Serbia.
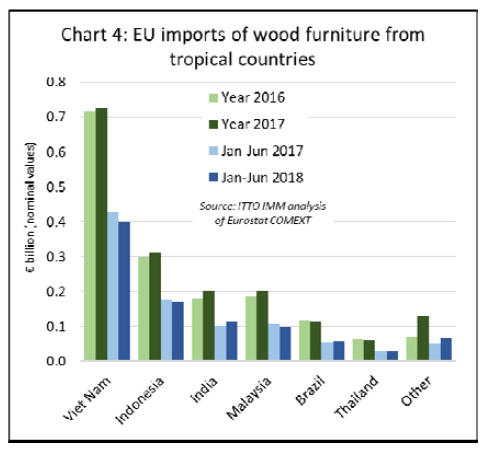
The main South East Asian supply countries have all
followed a similar trajectory in the EU wood furniture
market in the last 18 months. A rise in EU imports last
year was followed by a decline in the first six months of
2018.
After increasing 1% to €730 million in 2017, EU imports
from Viet Nam fell 6% to €400 million in the first six
months of 2018. Imports from Indonesia increased 4% to
€311 million in 2017 but fell back 4% to €171 million in
the first six months of 2018. Imports from Malaysia
increased 10% to €203 million in 2017 and were 8% down
at €99 million in the first 6 months of 2018.
In contrast, EU wood furniture imports from India have
continued to rise, up 12% to €103 million in the first six
months of 2018 after a 12% increase to €202 million for
whole of 2017. Imports from Brazil bounced back in the
first half of 2018, rising 4% to €57 million, after declining
5% to €112 million for the whole year 2017 (Chart 4).
There were also shifts in the destinations for wood
furniture imported into the EU from tropical countries in
the first half of 2018. Imports in the UK, the largest
market, were €339 million between January and June
2018, unchanged from the same period in 2017.
However, in the first half of 2018 there was a sharp fall in
imports of wood furniture from the tropics by Germany (-
11% to €123 million), Belgium (-8% to €39 million),
Spain (-12% to €37 million), and Italy (-4% to €31
million). These losses were partly offset by rising imports
in France (+1% to €134 million) and Netherlands (+12%
to €109 million) (Chart 5).
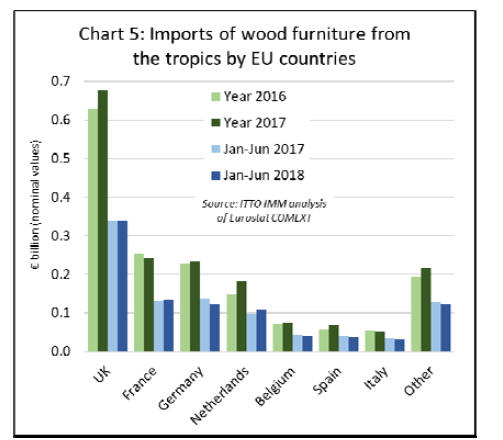
The large rise in Netherlands imports of wood furniture
from tropical countries in the first half of 2018 may be
related to the wider trend, mentioned earlier, to centralise
procurement functions within the EU, contributing to a
greater share of wood furniture trade passing through
Dutch ports.
|