|
Report from
North America
Higher year on year January 2016 imports
US imports of most processed wood products declined
from December to January with the exception of
hardwood mouldings. However, Imports remained
significantly higher compared to January 2015.
Hardwood plywood imports down in January
Hardwood plywood imports fell 9% in January to 268,282
cu.m., worth US$154.2 million. Year-to-January imports
were 13% higher than in January 2015.
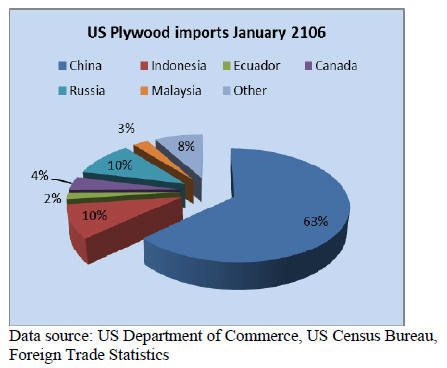
Imports from China were unchanged at 159,586 cu.m. in
January, while imports from most other major suppliers
declined.
Indonesia’s shipments to the US fell 39% to 36,701 cu.m.
but were above January 2015 volumes. Hardwood
plywood imports from Malaysia dropped 66% from
December to just 3,780 cu.m.
Italy, Taiwan P.o.C and Vietnam shipped substantially
more plywood to the US market in January compared to
the previous year. Imports from Italy were 8,427 cu.m., up
from an average 2,000 cu.m. per month in 2015.
Higher moulding imports from Brazil and Malaysia
Hardwood moulding imports were worth US$16.7 million
in January, up 3% from the previous month.
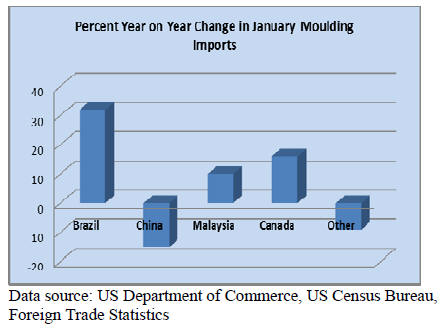
Imports from Brazil and Malaysia recovered after
declining towards the end of 2015. Imports from Brazil
were US$5.2 million in January, up 40% from December
and one third higher than the same time last year.
China was the second-largest source of mouldings at
US$4.9 million. Imports from China declined month-onmonth
as well as compared to January 2015.
Imports from Malaysia were worth US$1.1 million in
January, up 21% from December and 10% up from last
January. Moulding imports from Indonesia increased to
US$748,956 in January.
Lower flooring imports but higher Indonesian
shipments
Both hardwood flooring and assembled flooring panel
imports declined in January. Hardwood flooring imports
declined month-on-month to US$3.3 million in January.
But US imports were 25% higher than in January 2015.
Indonesia was the only major source of imports with
higher shipments to the US in January.
Hardwood flooring imports from Indonesia were worth
US$806,440 in January, followed by China with
US$743,100. Malaysian shipment fell to US$547,150 in
January. Imports from Vietnam halved from December to
US$280,950 in January.
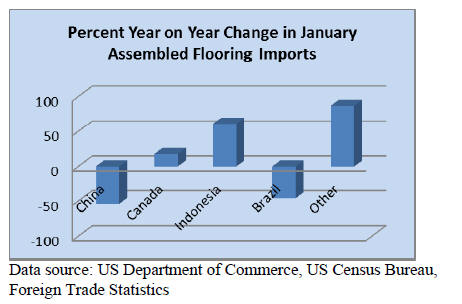
Imports of assembled flooring panels declined 12% to
US$8.9 million in January, down 22% from January 2015.
The drop was mainly in imports from China. China’s
shipments fell 30% from December to US$3.2 million.
Imports from Canada and Indonesia increased.
Imports from Indonesia were valued at US$851,767 in
January, up 61% from the same time last year.
Drop in furniture imports from Mexico
The total value of wooden furniture imported in January
declined 2% from the previous month to US$1.40 billion,
but imports were 12% higher than in January 2015.
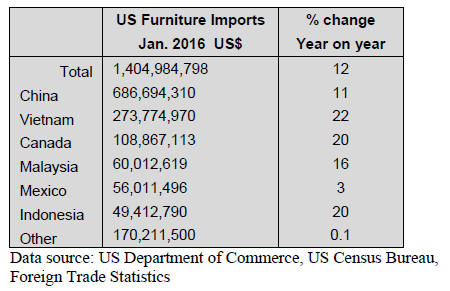
Furniture imports from China, Mexico and Indonesia
declined, while Vietnam, Canada and Malaysia shipped
more in January.
China’s furniture shipments were worth US$686.7 million
in January. Vietnam gained market share with imports
worth US$273.8 million. Vietnam’s share in total wooden
furniture imports was almost 20% in January. The recent
gain in import share by Vietnam was not at the expense of
China but largely because of reduced imports from
Europe.
Furniture imports from Malaysia grew to US$60.0 million
in January, surpassing Mexican shipments to the US.
Imports from Mexico fell 16% month-on-month to
US$56.0 million. Furniture imports from Indonesia were
almost unchanged in January at US$49.4 million.
Imports of not upholstered wooden seats increased 13% in
January, while upholstered seating declined 5%. Wooden
bedroom furniture imports were down 4%. Other types of
wooden furniture were almost unchanged from the
previous month.
GDP growth revised up to 1% in final quarter of 2015
Real GDP growth in the fourth quarter of 2015 was
stronger than previously estimated. The GDP grew by 1%
in the fourth quarter, not 0.7% as previously estimated,
according to the US Bureau of Economic Analysis. In the
third quarter, GDP increased 2.0%.
Stronger residential construction and consumer
consumption increased in the fourth quarter. Lower
imports contributed to GDP growth.
Unemployment was unchanged at 4.9% in February.
Industries with employment gains included retail trade.
The US Federal Reserve has decided to keep interest rates
between 0.25% and 0.5%. The central bank raised rates
last in December. The Federal Reserve announced it
would raise rates only twice a year in 2016, instead of the
previously expected four times. This gives the US
economy more time to recover given the risks from global
economic and financial developments.
Growth in wood products and furniture manufacturing
Economic activity in the manufacturing sector contracted
in February for the fifth consecutive month, according to
the Institute for Supply Management. The overall
economy continued to grow in February.
The wood products sector and furniture manufacturing
reported growth in February, despite the overall slowdown
in manufacturing. Wood products and furniture reported
the second and third-highest growth rate, respectively, of
all industries.
Consumers confident on personal finances and job
market
Consumer confidence declined in early March, according
to University of Michigan Index of Consumer Sentiment.
Americans were concerned about prospects for the
economy and the possibility of higher gasoline prices.
Despite some uncertainty consumers remained optimistic
about their personal finances and the job market. Growth
in personal consumption is forecast at 2.7% during 2016.
Housing starts up in February
2016 started with strong indicators from the market for
new housing. Housing starts in February were at a
seasonally adjusted annual rate of 1,178,000. This is 5%
higher than in January and 31% above the February 2015
rate of 900,000.
Single-family starts were almost unchanged from the
previous month at a rate of 731,000 in February.
The number of building permits approved in February was
at a seasonally adjusted rate of 1,167,000. This is 3%
below the January rate but higher than in February 2015.
Decline in sales of existing homes
Sales of existing homes fell 7% at a seasonally adjusted
annual rate in February, according to the National
Association of Realtors. Low supply, coupled with rising
prices in many areas of the country, were the main reasons
for the decline in home sales. Sales were still higher than
in February 2015.
Growth in homes sales may slow in 2016 if prices
continue to go up while potential buyers worry about
economic prospects and affordability. A slowdown in
sales would affect demand for wood products used in
repair and renovations.
Canadian government tries to cool housing market
Canadian housing starts grew 29% in February at a
seasonally adjusted annual rate, according to early
estimates by the Canadian Housing and Mortgage
Corporation. Despite the corporation’s forecast of
moderation in multi-family construction, the number of
multi-family starts increased significantly in February.
Sales of existing homes also increased in February, rising
by 0.8% from January on a seasonally adjusted basis,
according to the Canadian Real Estate Association.
Toronto and Vancouver had the strongest sales activity.
Home prices increased by over 20% in Vancouver from
just one year ago.
The federal government introduced new mortgage
insurance rules to contain risks in the housing market,
especially in Vancouver and Toronto. The new rules came
into effect in mid-February, but may have fuelled sales in
early February. The provincial government in British
Columbia announced it will track whether home buyers
reside in Canada or abroad. This is in response to claims
that foreign investors are a major driver of the hot housing
market.
It is unclear if or how the government will put restrictions
on the housing market to reduce home price increases. It
appears unlikely that the rate of new construction would
be significantly reduced given the region’s population
growth. The luxury market could be affected, including for
high-end wood products.
|