|
Report from
North America
Sawnwood imports from Africa up, sapelli a winner
US imports of temperate sawn hardwood recovered in
May and total sawn hardwood imports grew by 77% from
the previous month. Temperate species accounted for
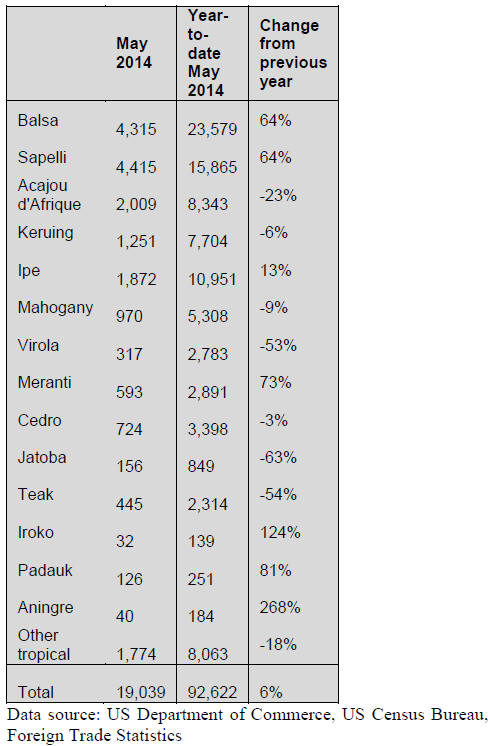
133,123 cu.m in May. Tropical imports were 19,039 cu.m,
down 4% from April. Year-to-date tropical imports were
6% higher than in May 2013.
The decline in tropical timber imports was almost entirely
due to lower balsa imports from Ecuador in May. Balsa
imports fell by 40% to 4,303 cu.m following very high
April import volumes.
Imports from Brazil declined by 5% in May to 2,399 cu.m.
There was only a slight decrease in ipe imports from
Brazil (1,790 cu.m), but jatoba and virola imports also fell.
Sawnwood imports from Malaysia, Indonesia and Peru
were down, but imports from Africa increased in May.
Imports from Cameroon grew by 32% to 2,832 cu.m. The
majority of Cameroon‟s shipments was sapelli (2,225
cu.m).
Imports from Congo/Brazzaville more than doubled in
May to 1,843 cu.m, again because higher sapelli shipments
(1,242 cu.m). Ghana shipped 905 cu.m of sawnwood to
the US in May, up 36% from the previous month.
Imports from Ghana were 498 cu.m of acajou d‟Afrique
and 370 cu.m of cedro, according to US trade statistis.
By species, sapelli overtook balsa as the large tropical
import in May (by volume). Sapelli sawnwood imports
were 4,415 cu.m and year-to-date imports were 64%
higher than in May 2013. Acajou d‟Afrique imports grew
to 2,009 cu.m in May, but year-to-date imports were 23%
lower than last year.
Much of the decline in tropical sawnwood imports in May
was in imports from Latin America and Asia: balsa,
keruing, ipe, virola, jatoba and teak.
Higher Canadian imports from Brazil in May
Canadian imports of tropical sawn hardwood were worth
US$2.47 million in May, up 11% from the previous
month. Year-to-date imports were 18% higher than in May
2013.
Three countries accounted for the bulk of import growth in
May: Brazil, the US and Congo/Brazzaville. Imports from
Brazil doubled to US$337,639. Tropical imports via the
US were worth US$376,881, up 118%. Importsfrom
Congo increased by 136% to US$199,104.
Ecuador shipped US$ 364,973 worth of sawnwood in
May, up 25% from the previous month. Canada‟s imports
from Cameroon, Congo/Zaire, Indonesia and Malaysia
were down in May.
By species, Canadian imports of virola, imbuia and balsa
combined increased by 23% in May to US$382,762.
Import of sapelli sawnwood declined, but at US$2.2
million year-to-date sapelli remains the most significant
tropical import species in Canada.
Analysis of N. American furniture market
Housing market affects furniture demand
Demand for furniture has slowly grown since the financial
crisis. At its lowest point in 2009, new furniture orders
were worth US$18.8 billion, according to Smith the
Leonhard data. Since 2009 new furniture orders have
increased 4-6% every year.
The growth in furniture demand has been steadier than the
housing market recovery, although homes sales play an
important role in the demand for furniture.
Furniture consumption has been supported by lower
unemployment and growing consumer confidence in the
US economy. In the first quarter of 2014 the GDP declined
mainly due to weather events, but positive economic
growth is expected for the rest of the year. If the housing
market recovery gains momentum, furniture sales will
greatly increase.
More positive outlook for domestic manufacturing
Over the past 10-15 years US furniture manufacturers
suffered, not only from shrinking demand during the
recession, but from competition from offshore
manufacturers and imports. Furniture supply chains,
technology and consumer trends changed dramatically.
Many US manufacturers outsourced production, while
others had to close or declared bankruptcy. Imports
dominate the US furniture market now.
Furniture industry analysts have recently been more
positive on the future of domestic furniture manufacturing.
Many US furniture companies have improved sales and
profit margins since the recession, even if there has not
been a significant shift away from overseas
manufacturing.
With labour costs in China and Vietnam on the rise and a
less favourable dollar-yuan exchange rate for exports from
China, it may become less cost-effective for US
manufacturers to produce in China and other East Asian
countries. Shipping costs and the logistics of far flung
supply chains also affect the location of manufacturing
plants.
While the US may remain the location of choice for highend
furniture producers, lower end products may
increasingly be made in Mexico instead of East Asia.
Mexico has the advantage of low wages, close proximity
to the US market and duty free shipping under the North
American Free Trade Agreement (NAFTA).
Furniture imports accelerating
2013 US wooden furniture imports were worth US$13.6
billion, up 7% from 2012. The 12-month moving average
in May 2014 was US$1.25 million, almost 10% higher
than in May 2013. The 12-month moving average
eliminates seasonal and other variability in monthly data,
allowing for a more meaningful analysis.
When comparing wooden furniture imports with retail
sales and estimated shipments of furniture (including nonwood
materials) the trends are similar. Furniture
shipments estimated by Smith Leonard followed retail
sales of furniture and home furnishing very closely
between 2011 and May 2014.
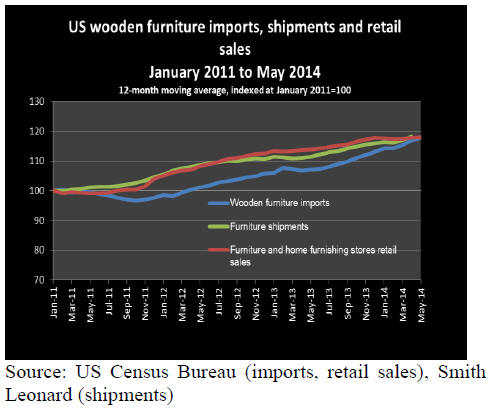
Wooden furniture imports trailed retail sales until the
spring 2014, suggests US domestic manufacturers
increased their market share between 2011 and 2013.
However, by April 2014 import growth surpassed the
growth in retail sales, and it is difficult to tell from the data
whether US furniture companies producing domestically
have been able to maintain any market share gains.
China’s imports share declines to under 49%
China dominates the US furniture market with an import
share of around 50%. Imports from China totaled $6.6
billion in 2013, up 6% from the previous year. On a
monthly, 12-month moving average basis, China‟s imports
share has declined from 51% at the start of 2011 to under
49% in May 2014.
It is too early to tell whether China will lose its preeminent
position in the US furniture market or whether the decline
remains a relatively small shift towards more imports from
Vietnam, other Asian countries and Mexico.
The growth in US imports is expected to continue, as
suppliers such as India and Russia expand their export
markets.
Vietnam is the US market‟s second-largest supplier with
imports worth $2.0 billion in 2013. Vietnam‟s import
share grew steadily from 13.5% in January 2011 to 16.4%
in May 2014.
Furniture imports from NAFTA partners Mexico and
Canada grew in recent years. The increase was mainly in
imports from Mexico (US$521 million in 2013), but
Canada is still a larger furniture exporter to the US at
US$1.1 billion in 2013.
The NAFTA countries‟ import share increased slightly
from 11.9% in January 2011 12.6% in May 2014.
Furniture imports from Malaysia declined by 16% in 2013
to $543.7 million, but in 2014 imports from both Malaysia
and Indonesia are up by over 20% compared to the same
time last year.
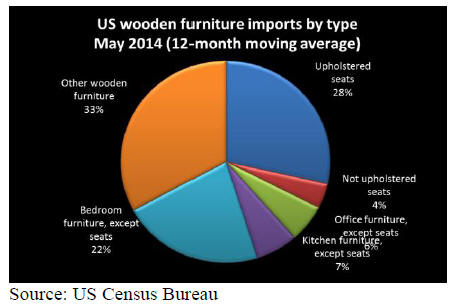
Imports by type of furniture
The largest change in the type of wooden furniture
imported over the past three years has been in upholstered
furniture. The share of upholstered seats in total imports
grew from 25% in 2011 to 28% in May 2014 (12-month
moving average).
The share of wooden bedroom furniture fell by one
percentage point over the same time, while kitchen
furniture import shares grew from 6% to 7%.
Higher US wood furniture exports
With a wooden furniture trade balance of US$-11.7 billion
in 2013 the US remains the world‟s largest importer of
furniture. In the past few US manufacturers troubled
themselves with developing international markets, but
exports have grown over the last decade.
Growing demand for high-end furniture in China, India,
Latin America and the Middle East created opportunities
for US companies willing to deal with style and cultural
differences, ocean shipping and language barriers.
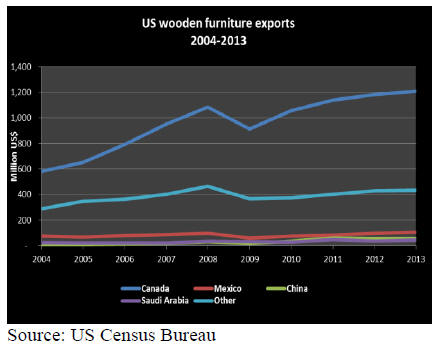
Between 2004 and 2013 annual growth in wooden
furniture exports was close to 10%. The rise in exports
was only briefly interrupted in 2009 by the financial crisis.
The strongest growth was in shipments to China, but
Canada is by far the largest market for US manufacturers
at US$1.2 billion in 2013, including re-exports from other
countries.
Exports to the Middle East have grown significantly.
Saudi Arabia is the largest market at US$43.7 million in
2013, followed by the United Arab Emirates (US$27.1
million) and Qatar (US$19.0 million).
|